1. Introduction
The strategic deployment of Molecular Markers has fundamentally redefined the landscape of modern biotechnology, facilitating a critical shift from traditional phenotypic observation to sequence-level precision. In the contemporary laboratory, Genetic Analysis relies on the identification of DNA Polymorphisms to bypass environmental masking and interrogate the genome directly. By integrating Genomic Selection into elite breeding programs, researchers can now facilitate the high-resolution dissection of complex traits, ensuring that favorable alleles are fixed with deterministic accuracy. The evolution of these genomic tools has effectively bridged the gap between basic research and field application, redefining the operational boundaries of both animal and plant sciences.
1.1 The Evolution of Genetic Selection: From Phenotypes to DNA
The transition from traditional phenotypic selection to molecular genetics represents a fundamental strategic shift in the management of livestock populations. Historically, breeding progress relied on morphological, chromosomal, and biochemical markers; however, these methods are inherently inefficient due to low genome coverage and the inability to distinguish between complex genotypic classes. To maintain competitive, high-performing populations, breeding organizations must move beyond observational selection. Modern genomic strategy allows breeders to target the underlying genetic architecture directly, bypassing the limitations of traditional selection—which often struggles with traits that are difficult to measure, have low heritability, or are expressed only after significant capital investment.
The shift toward DNA-based tools is a strategic response to the flaws of earlier systems. Morphological markers are frequently sex-limited and age-dependent, restricting their utility to specific subsets of a herd. Furthermore, biochemical markers typically exhibit low degrees of polymorphism and are susceptible to environmental interference, which obscures the true genetic potential of an individual.
Core Strategic Advantages
• High Heritability: DNA-based markers are stable and provide a consistent assay of genetic merit across generations, unlike phenotype-driven metrics.
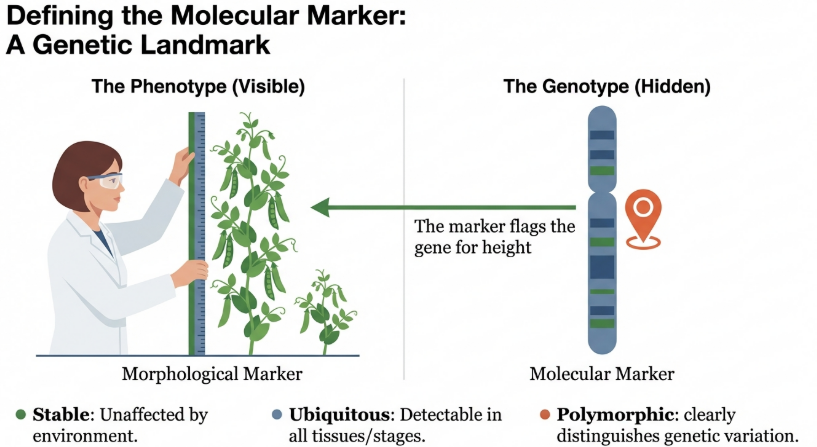
• Genome-Wide Ubiquity: Molecular markers are distributed throughout the entire genome, allowing for comprehensive mapping that morphological traits cannot provide.
• Environmental Independence: DNA sequences are not influenced by external factors, ensuring that selection decisions are based on inherent genetic potential rather than management-induced variation.
• Accelerated Selection Intervals: Genetic data is available from conception, enabling breeders to identify elite performers years before adult productivity or survival rates can be phenotypically measured.
This evolution in methodology necessitates a sophisticated understanding of the molecular taxonomy required to meet specific breeding objectives.
2. The Evolutionary Trajectory of Genetic Markers
Historical genetic analysis was constrained by the inherent limitations of morphological, chromosomal, and biochemical markers. Morphological markers are frequently sex-limited, age-dependent, and susceptible to significant environmental influence, while biochemical markers often exhibit insufficient polymorphism to be broadly informative. The strategic transition to DNA-based systems was necessitated by the requirement for ubiquitous, highly heritable markers that allow for “gene discovery” across all developmental stages. This shift moves breeding from a “probabilistic” outcome based on outward performance to a “deterministic” one where outcomes are dictated by confirmed genomic content.
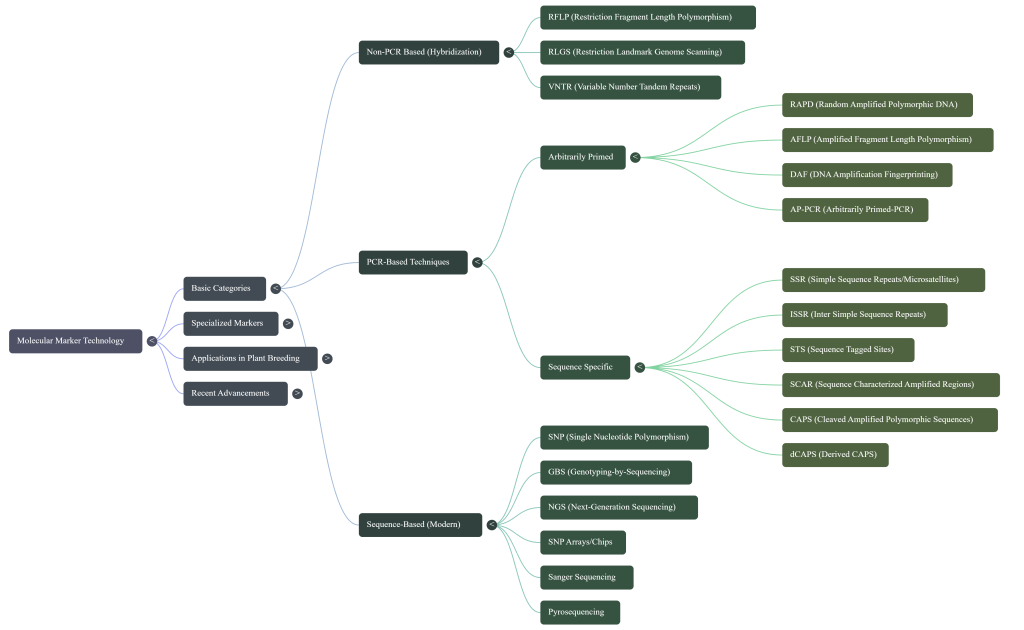
Modern genetic mapping distinguishes between two primary classes of molecular tools:
• Type I Markers: These represent evolutionarily conserved coding sequences (e.g., classical RFLPs and SSLPs). They are indispensable for comparative mapping strategies between species, though their often di-allelic nature limits their utility in higher-order linkage analysis.
• Type II Markers: Exemplified by microsatellites, these possess high polymorphism information content. They facilitate the rapid generation of high-density maps and are the preferred choice for detailed linkage interrogation.
Table 1: Comparative Evaluation of Selection Methodologies
| Differentiator | Traditional Phenotypic Selection | Molecular-Based Selection (MAS) |
|---|---|---|
| Operational Basis | Probabilistic; depends on outward expression | Deterministic; based on specific DNA sequence |
| Environmental Influence | Significant; can mask the true genotype | Negligible; markers are environmentally independent |
| Selection Timing | Often late-life (e.g., survival, milk yield) | Any stage; enables “speed breeding” protocols |
| Heritability | Variable; low efficiency for complex traits | Absolute; DNA markers are highly heritable |
| Selection Intensity | Limited to measurable physical traits | High; allows pyramiding of recessive genes |
Understanding this trajectory is essential for evaluating the specific methodologies that currently define the frontier of molecular breeding.
| Era | Focus | Key Limitations / Strengths |
|---|---|---|
| The Phenotypic Era | Physical traits (Morphology) | Limitation: Heavily masked by environment; “guessing game” due to low heritability. |
| The PCR / Type II Era | DNA Repeats (Microsatellites) | Strength: High variability (70%+ heterozygosity) and low DNA requirements (10-100ng). |
| The Genomic Era | Single Letters (SNPs / GBTS) | Strength: Ultra-high throughput, automation, and liquid-chip flexibility for MAS. |
Timeline of Marker Evolution and Cross-Disciplinary Innovation
The following table summarizes the technical evolution of molecular markers, including emerging high-throughput platforms adapted from plant genomics to enhance animal research precision:
| Year | Acronym | Nomenclature | Ethical or Technical Significance |
|---|---|---|---|
| 1974 | RFLP | Restriction Fragment Length Polymorphism | First-class markers; enabled highly saturated linkage maps. |
| 1986 | ASO | Allele Specific Oligonucleotides | Specific for single alleles; revolutionized genetic testing and forensics. |
| 1988 | AS-PCR | Allele Specific PCR | Inexpensive SNP genotyping; critical for pharmacogenomics. |
| 1989 | SSCP | Single Strand Conformation Polymorphism | Sensitive mutation detection; now largely supplanted by sequencing. |
| 1989 | STS | Sequence Tagged Site | Unique genomic landmarks; vital for detecting microdeletions. |
| 1990 | RAPD | Randomly Amplified Polymorphic DNA | PCR-based fingerprinting; significant reproducibility challenges. |
| 1991 | RLGS | Restriction Landmark Genome Scanning | Powerful for detecting DNA methylation and active regions. |
| 1992 | SSR | Simple Sequence Repeats (Microsatellites) | Hyper-variable and co-dominant; the marker of choice for diversity. |
| 1994 | ISSR | Inter Simple Sequence Repeats | Quick multi-locus marker generation for phylogeny and gene tagging. |
| 1994 | SNP | Single Nucleotide Polymorphism | Most common genetic variation; enables highly automated scanning. |
| 1995 | AFLP | Amplified Fragment Length Polymorphism | Highly sensitive; identifies over 50 loci in a single reaction. |
| 1999 | MSAP | Methylation Sensitive Amplification Polymorphism | Detects cytosine methylation; vital for epigenetic analysis. |
| 2000 | MITE | Miniature Inverted-Repeat Transposable Element | Fundamental in shaping and understanding genome evolution. |
| 2002 | SSLP | Simple Sequence Length Polymorphism | Used for genetic monitoring of inbred laboratory strains. |
| 2018 | KASP | Kompetitive Allele Specific PCR | High-throughput fluorescence-based genotyping for target traits. |
| 2022 | GBTS | Genotyping by Target Sequencing | Includes liquid-chip platforms (GenoBaits); reduces animal use via precision. |
3. Analysis of Hybridization and PCR-Based Markers
First and second-generation markers provided the foundational pillars for genetic mapping, enabling the first direct detection of polymorphisms at the DNA sequence level.
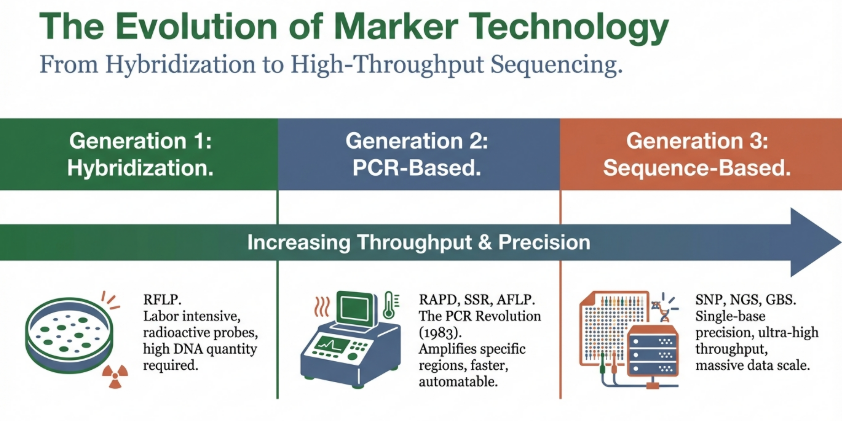
• RFLP (Restriction Fragment Length Polymorphism): This method utilizes restriction endonucleases to achieve enzymatic cleavage of DNA at specific recognition sites. If mutations alter the distance between these sites, the resulting fragment lengths vary, creating unique patterns visible via Southern blotting.
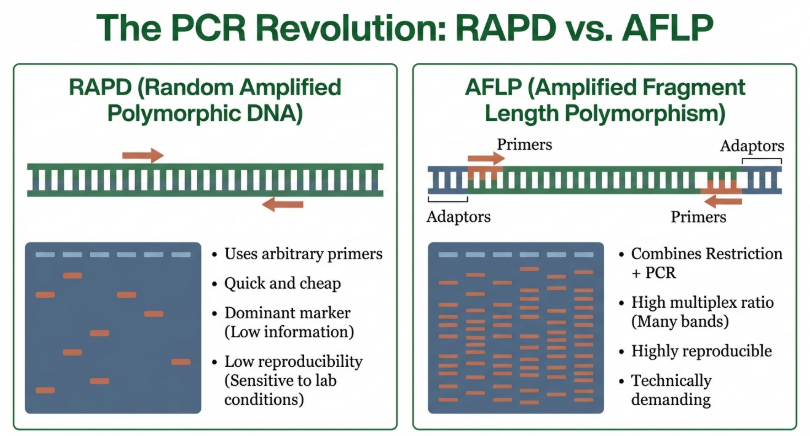
• RAPD (Random Amplified Polymorphic DNA): A PCR-based technique employing arbitrary 10-mer primers. While RAPDs once provided an “arbitrary sample of the genome” without requiring prior sequence knowledge, they have become a cautionary tale in genomic history due to a chronic lack of reproducibility and inconsistency across laboratories.
• AFLP (Amplified Fragment Length Polymorphism): A highly sensitive hybrid method combining restriction digestion with PCR. It involves the ligation of oligonucleotide adaptors to DNA fragments, followed by selective amplification using primers complementary to those adaptors.
As established in the primary literature, molecular markers facilitate “three-fold applications in gene mapping: (i) a marker allows the direct identification of the gene of interest instead of the gene product… (ii) …helps in physical mapping of the genes using in situ hybridization; and (iii) …provide sufficient markers for construction of genetic maps using linkage analysis.” Despite their utility, the limitations of these gel-based systems necessitated the move toward higher-resolution microsatellite and sequence-specific technologies.
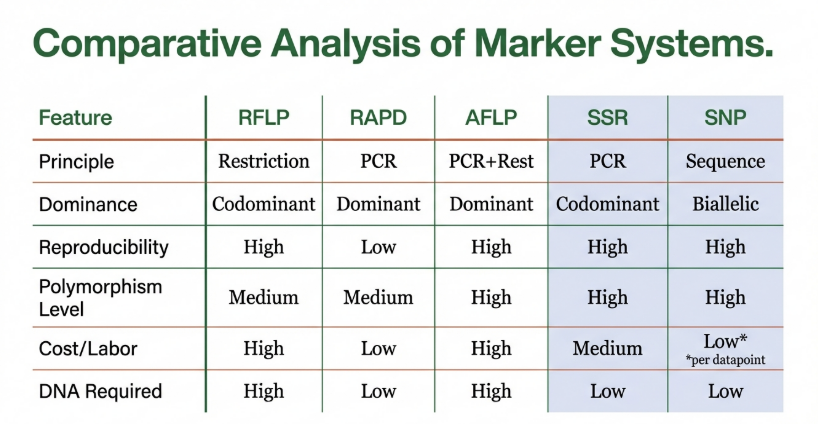
| Marker Type | Primary Methodology | Strategic Utility / Application | Level of Polymorphism |
|---|---|---|---|
| RFLP | DNA digestion with restriction enzymes to identify fragment length variations. | Genome mapping and identifying genetic disease carriers; high saturation of linkage maps. | Low to Moderate |
| RAPD | PCR-based amplification using single, short, random oligonucleotide primers. | Taxon identification and genetic structure analysis without prior sequence knowledge. | Moderate |
| SNP | Direct sequencing or array-based detection of single nucleotide changes (substitutions/deletions). | High-throughput genomic selection, automated stock identification, and GWAS. | Bi-allelic |
| Microsatellites | Amplification of tandemly repeated DNA sequences (1–6 bp). | Parentage determination, genetic distance estimation, and linkage analysis. | High (Multi-allelic) |
4. Microsatellites and the Precision of Repeat Sequences
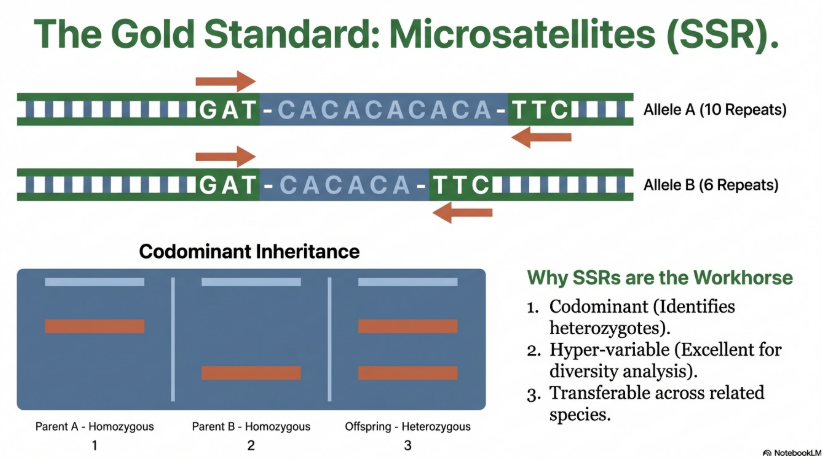
Simple Sequence Repeats (SSRs), or microsatellites, remain a “marker of choice” for diversity analysis. Their hyper-variability and co-dominant inheritance enable the clear detection of polymorphisms within and between populations.
Categorized Microsatellite Variants
• SSR (Simple Sequence Repeat): Repeats of 2–6 base pairs; primary tools for kinship and population structure studies.
• ISSR (Inter Simple Sequence Repeat): Employs microsatellite sequences as primers to generate multi-locus markers; ideal for phylogeographical analysis.
• VNTR (Variable Number of Tandem Repeats): Tandem repeats of sequences >6 nucleotides (minisatellites); essential for forensic testing and DNA fingerprinting.
• STMS (Sequence Tagged Microsatellite Site): Loci recovered via PCR using specific flanking primers. These serve as common reference points that facilitate the incorporation of physical mapping data into evolving genetic maps.
• SSLP (Simple Sequence Length Polymorphism): Repeated sequences over varying lengths in intergenic regions; utilized for the genetic monitoring of inbred strains (e.g., in rats).
Technical Breakdown: Allelic States
The detection of microsatellites relies on PCR primers unique to the flanking regions of the repeat.
• Homozygous Locus: Both alleles contain the identical number of repeats (e.g., 46 bp fragments on both chromosomes).
• Heterozygous Locus: Alleles contain differing repeat numbers, producing distinct fragment sizes (e.g., one 46 bp fragment and one 50 bp fragment).
Differentiator Analysis: Microsatellites facilitate the interrogation of small samples, requiring only 10–100 ng of template DNA, and offer high mean heterozygosity (>70%). However, they are expensive to develop and can produce “stutter bands”—minor peaks differing by two nucleotides—that complicate accurate scoring.
5. High-Throughput Genotyping and the SNP Revolution
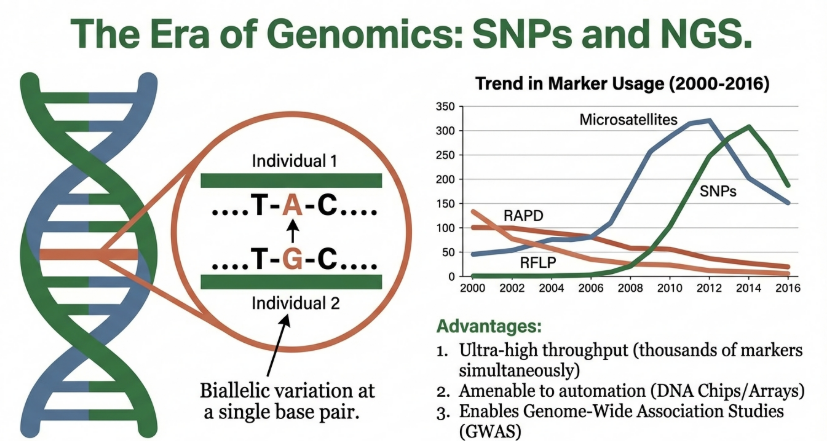
Single Nucleotide Polymorphisms (SNPs) represent the most frequent genetic variation, occurring at a density of one per 370–540 bp in the wheat genome. Their biallelic nature and high frequency enable ultra-high-throughput genomic discovery.
• GBS (Genotyping by Sequencing): This NGS-based approach uses enzyme digestion to reduce genome complexity. It has successfully facilitated the mapping of Hessian fly resistance genes (h4 and H7) to chromosomes 1A and 6A.
• SNP Arrays: Solid chips available in various densities (15K to 820K). The 660K array, based on hexaploid and tetraploid wheats, is particularly effective for evaluating hexaploid germplasm.
• Exome Capture: An alternative to Whole Genome Sequencing (WGS), focusing on the ~2% of the genome containing coding sequences. This has enabled the identification of leaf rust resistance genes (Lr1,Lr10,Lr21).
• GBTS (Genotyping by Target Sequencing): A liquid chip technology utilizing GenoPlexs (multiplex PCR) and GenoBaits (probe-in-solution). This platform is highly upgradable, allowing new loci to be added to existing panels without resynthesis.
These platforms enable the high-resolution dissection of complex traits, which is essential for “speed breeding” and global food security.
6. Marker Transformation: Field Deployment Tools
While NGS and high-density arrays are superior for discovery, they are often too expensive or data-intensive for daily “bin/no-bin” decisions in a field nursery. Therefore, converting high-throughput SNPs into inexpensive, functional markers is the practical bridge between the lab and the farm.
• KASP (Kompetitive Allele Specific PCR): A fluorescence-based assay using two allele-specific forward primers (FAM/HEX tags) and a common reverse primer. It is the current industry standard for SNP conversion.
• STARP (Semi-thermal Asymmetric Reverse PCR): Utilizes AMAS-primers (asymmetrically modified allele-specific primers). It is more cost-effective than KASP because it requires no proprietary master mix, making it accessible for budget-constrained breeding projects.
• CAPS/dCAPS: These involve PCR followed by restriction enzyme digestion. If an SNP creates or destroys a restriction site, the resulting gel pattern indicates the genotype.
These converted markers enable Marker-Assisted Selection (MAS) by allowing breeders to pyramid multiple resistance genes—even recessive ones—without phenotypic evaluation in every generation.
7. Strategic Applications in Biotic and Abiotic Stress Tolerance
Pathogens and climate change cause average yield losses in wheat of 21.5%. Molecular markers allow for the targeted selection of loci that provide resistance to these economic stressors.
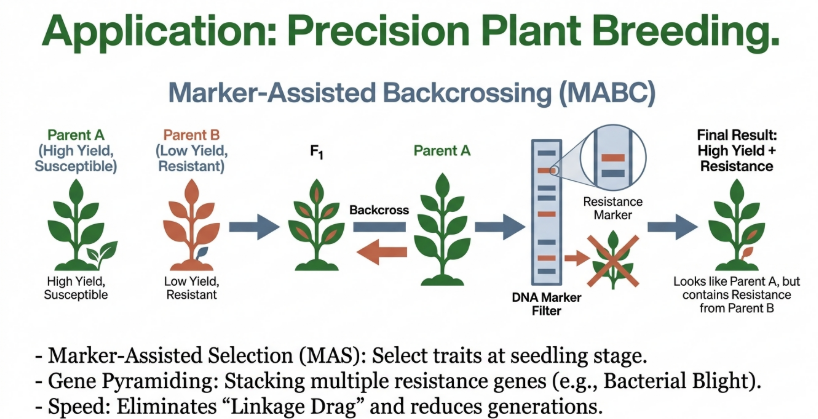
Table 2: Critical Loci and Linked Markers for MAS
| Trait | Locus | Linked/Functional Marker | Benefit |
|---|---|---|---|
| Fusarium Head Blight | Fhb1 | TaHRC-GSM / TaHRC-KASP | Major resistance from cultivar Sumai3 |
| Powdery Mildew | Pm60 | M-Pm60-S1 | Distinguishes functional (Pm60a) alleles |
| Leaf Rust | Lr22a | Kwh636 (KASP) | Broadly effective resistance |
| Stem Rust | Sr13 | KASPSr13 / rwgsnp37 | Robust resistance in tetraploid/bread wheat |
| Drought Tolerance | TaWRKY51 | B-Hpa11 (CAPS) | Improved root architecture/water uptake |
| Cold Hardiness | Fr-A2 | S1862541 (KASP) | Major QTL for winter frost resistance |
| Lodging Resistance | TaCOMT-3B | TaCOMT-3BM (Indel) | Increased stem lignin via COMTa haplotype |
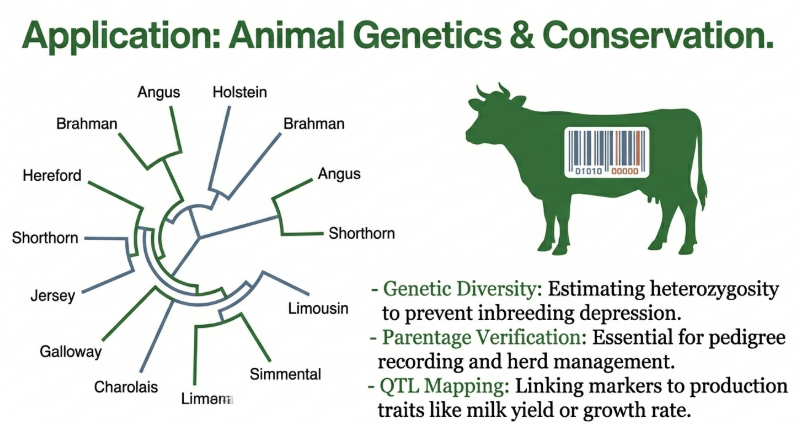
In animal science, these markers are vital for parentage testing (achieving >90% exclusion probability), identifying twin zygosity, and screening for disease carriers (detecting heterozygous animals phenotypically indistinguishable from normal stock).
8. The Socio-Ethical Landscape of Genetic Biotechnology
The use of genetic biomarkers and cloning necessitates a rigorous ethical framework to address concerns regarding animal welfare, privacy, and scientific integrity.
• Animal Welfare: Cloning and invasive interventions, such as surgical oocyte extraction in sheep and pigs, raise significant concerns. Cloned animals frequently suffer from “Large Offspring Syndrome” (LOS), which leads to painful births and necessary cesarean sections. This represents a significant “Inefficiency and Waste of Life.”
• Postnatal Complications: Survivors of LOS often face short lives of suffering characterized by gastroenteritis, umbilical infections, and cardiovascular or musculoskeletal defects.
• Scientific Integrity: Researchers have a fiduciary obligation to protect the privacy of genetic information and prevent the abuse of data or the psychological impact of disclosed biomarkers.
• Regulatory Oversight: Groups like the European Group on Ethics (EGE), APHIS, and the Canadian Council on Animal Care (CCAC) provide the standards for humane treatment.
The debate centers on the “Functional” view of animals as creatures with societal purpose versus the “Sentient” view of beings with intrinsic value. This is reflected in EU Directive 98/58/EC, which prohibits breeding procedures likely to cause suffering.
9. Strategic Implementation and Future Outlook
The “translational significance” of molecular markers lies in the ability to select for traits previously deemed too costly or difficult to record. The core strategic imperative remains choosing the “right marker for the right problem” to optimize returns for breeding organizations and farmers.
Next-Generation Liquid-Chip Platforms
While solid-based SNP arrays have been instrumental, the future of genomic strategy lies in Genotyping by Target Sequencing (GBTS), which offers superior customization and flexibility:
• GenoPlex (Multiplex PCR-based): High-efficiency target sequencing that can be rapidly updated with newly discovered loci.
• GenoBaits (Probe-in-solution): A liquid-chip methodology that accurately captures sequences at specific positions, bypassing the limitations of repeated sequences and rigid solid arrays.
These liquid-chip platforms allow for higher customization and lower infrastructure costs, redefining the speed and accuracy of livestock genetic improvement.
10. Conclusion
Molecular markers represent a transformative force in modern genetics, providing the essential tools to increase productive efficiency and conserve global genetic resources. By facilitating the precise selection of traits for biotic and abiotic stress tolerance, these technologies are indispensable for global food security. Continued investment in genomic infrastructure and a commitment to the ethical application of biotechnology are required to realize the full potential of these deterministic breeding systems.
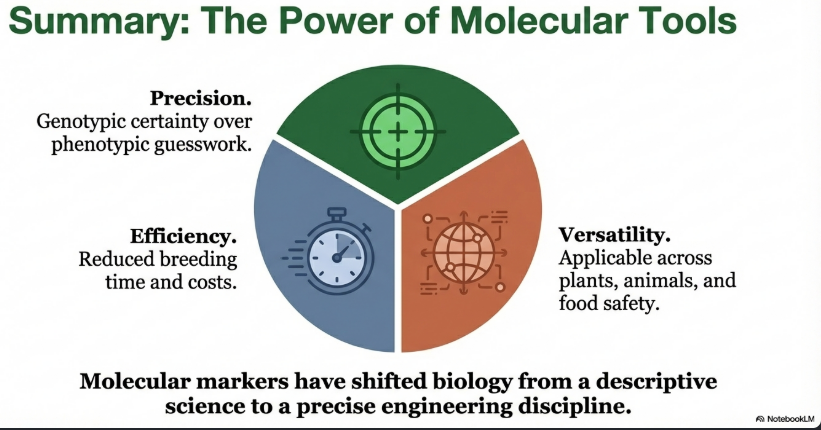
Image Summary

Questions/Answers
1. How have molecular markers evolved from allozymes to modern sequencing?
The evolution of molecular markers has progressed through three conceptual classes: protein variants (allozymes), DNA repeat variation, and DNA sequence polymorphism. This journey has transitioned from indirect biochemical analysis to direct, high-throughput DNA sequencing.
1. The Starting Point: Allozymes and Isozymes
The first generation of true molecular markers were allozymes, which are allelic variants of enzymes.
• Principle: These markers distinguish protein variants using gel electrophoresis based on differences in size and electrical charge caused by amino acid substitutions.
• Advantages: They are cost-effective, easy to analyze, and usually exhibit codominant inheritance, making genetic interpretations straightforward.
• Limitations: Their use is limited because they are products of gene expression rather than the genetic material itself, meaning they can be affected by environmental factors and plant growth stages. Additionally, the number of informative marker loci is too small for modern mapping or association studies.
2. First Generation DNA Markers: RFLPs and RAPDs
The arrival of DNA manipulation techniques promoted a shift toward direct DNA analysis.
• RFLPs (Restriction Fragment Length Polymorphisms): Developed in 1980, RFLPs were the first DNA markers used for mapping. They are hybridization-based, relying on restriction enzymes to cut DNA at specific sites, which are then visualized via Southern blotting. While reliable and codominant, they are labor-intensive, require large amounts of high-quality DNA, and involve radioactive reagents.
• RAPDs (Random Amplified Polymorphic DNA): Developed in the late 1980s, RAPDs were the first PCR-based markers. They use a single short, arbitrary primer to amplify random DNA segments. They are quick and easy to generate without prior sequence knowledge but suffer from low reproducibility and dominant inheritance, meaning they cannot distinguish between homozygotes and heterozygotes.
3. Second Generation: SSRs and AFLPs
In the 1990s, more reliable PCR-based systems emerged.
• SSRs (Simple Sequence Repeats/Microsatellites): These are short tandem repeats (e.g., ATATAT) distributed throughout the genome. SSRs became the “marker of choice” for over a decade because they are highly polymorphic, abundant, robust, and codominant.
• AFLPs (Amplified Fragment Length Polymorphisms): This technique combines the reliability of RFLPs with the flexibility of PCR. AFLPs generate high-density “fingerprints” by selectively amplifying restriction fragments. They are highly reproducible and do not require prior sequence information but are primarily dominant markers and technically demanding.
4. Third Generation: SNPs and High-Throughput Sequencing
The modern era is defined by the move toward sequence-based markers and automated platforms.
• SNPs (Single Nucleotide Polymorphisms): SNPs are single base pair changes in the DNA sequence. They are the most abundant form of genetic variation in the genome. Because they are biallelic and highly stable, they are ideal for high-throughput automated analysis and genome-wide association studies (GWAS).
• NGS (Next-Generation Sequencing): This technology revolutionized the field by enabling the simultaneous sequencing of millions of DNA fragments. NGS allows for comprehensive analysis of genetic diversity and the discovery of thousands of markers in a single run.
• GBS (Genotyping-by-Sequencing): A powerful modern application of NGS, GBS selectively sequences a subset of the genome to discover and genotype SNPs simultaneously at a reduced cost. This approach is particularly effective for complex genomes and non-model species.
Summary of Evolution: Molecular marker technology has shifted from gel-based, labor-intensive assays to chip-based and sequencing-based platforms that offer unprecedented precision, efficiency, and scale.
2. How do codominant markers like SSRs differ from dominant ones?
The primary difference between codominant markers, such as SSRs, and dominant markers lies in their ability to distinguish between homozygous and heterozygous individuals.
1. Codominant Markers (e.g., SSRs, RFLPs, SNPs)
Codominant markers are those for which both alleles are expressed when they co-occur in an individual.
• Genotype Distinction: These markers allow researchers to clearly distinguish between homozygous and heterozygous states. For instance, in an SSR assay, two bands of different sizes would indicate a heterozygote, while a single band would indicate a homozygote.
• Information Content: They are generally more informative because they provide specific genotypes and allele frequencies at a given locus.
• Breeding Application: In plant breeding, codominant markers like SSRs and SNPs allow for the selection of recessive alleles in a heterozygous state. This eliminates the need for time-consuming selfing or test-crossing to verify the presence of recessive traits, thereby accelerating the breeding process.
• Examples: SSRs (Simple Sequence Repeats), RFLPs (Restriction Fragment Length Polymorphisms), SNPs (Single Nucleotide Polymorphisms), and CAPS (Cleaved Amplified Polymorphic Sequences).
2. Dominant Markers (e.g., RAPDs, AFLPs, ISSRs)
Dominant markers generally detect polymorphism as the presence or absence of a DNA band (a plus/minus type of polymorphism).
• Genotype Distinction: These markers cannot distinguish between an individual that is homozygous for the presence of a band and one that is heterozygous. If a band is visible on a gel, it only indicates that at least one copy of the allele is present.
• Mechanism of Variation: In markers like RAPDs, the polymorphism often results from a mutation at the primer binding site; if the site is lost, no amplification occurs, leading to the “absence” score.
• AFLP Nuance: While AFLPs are typically scored as dominant markers, they can sometimes be analyzed as codominant by using automated gel scanners that distinguish between band intensities (homozygotes having stronger signals than heterozygotes).
• Examples: RAPDs (Random Amplified Polymorphic DNA), ISSRs (Inter Simple Sequence Repeats), and DArT (Diversity Array Technology).
Summary of Differences
| Feature | Codominant Markers (e.g., SSR) | Dominant Markers (e.g., RAPD) |
|---|---|---|
| Allele Expression | Both alleles are detected | Only one allele (presence/absence) |
| Heterozygote Detection | Yes, distinguishable from homozygotes | No, indistinguishable |
| Information Content | High; multiple alleles per locus | Lower; usually biallelic (presence/absence) |
| Efficiency in MAS | High; can track recessive genes in heterozygotes | Lower; requires further testing for recessive traits |
3. What is Genotyping-by-Sequencing and how does it work?
Genotyping-by-sequencing (GBS) is a high-throughput, cost-effective molecular tool used to simultaneously discover and genotype genetic variation (primarily SNPs) within a population. It is an application of Next-Generation Sequencing (NGS) that focuses on sequencing only a subset of the genome to reduce complexity, making it suitable for large genomes and both well-characterized and non-model species.
How GBS Works
The process typically involves reducing the complexity of a large genome by focusing on regions near specific restriction sites. The key steps are as follows:
1. Library Preparation and Digestion: DNA is extracted from multiple samples and digested using specific restriction enzymes. These enzymes cut the DNA at particular recognition sites, creating fragments.
2. Ligation of Barcodes (Multiplexing): Unique DNA barcodes (indexes) and universal adapters are ligated to the ends of the DNA fragments for each sample. This allows many individuals to be pooled and sequenced in a single run, significantly lowering costs.
3. Fragment Selection and Amplification: The pooled DNA library is sometimes size-selected to target specific regions. The fragments are then amplified using PCR (polymerase chain reaction).
4. Sequencing: The amplified fragments are sequenced using NGS platforms (such as Illumina).
5. Data Analysis: Bioinformatics tools process the resulting sequence data to identify genetic variations by comparing them to a reference genome. This identifies the specific alleles and variants (such as SNPs) associated with traits.
Key Advantages and Disadvantages
• Advantages: GBS is cost-effective because it requires less DNA and uses multiplexing to process many samples at once. It does not require prior knowledge of SNPs or the genome, avoiding ascertainment bias. It provides better genome coverage than older systems like SSRs.
• Shortcomings: The method can be affected by errors due to low read coverage and may have a poor capacity to identify true homozygotes. Its performance is also highly dependent on the quality of the reference genome used for alignment.
Applications in Plant Breeding
GBS has revolutionized molecular breeding by facilitating:
• Trait and QTL Mapping: Identifying genomic regions associated with traits like disease resistance or yield.
• Diversity Analysis: Assessing the genetic structure and diversity within crop populations to select parents for breeding.
• Genomic Selection (GS): Predicting the breeding value of individuals based on high-density marker data.
• High-Resolution Linkage Maps: Constructing dense maps even for species without extensive prior genomic information.
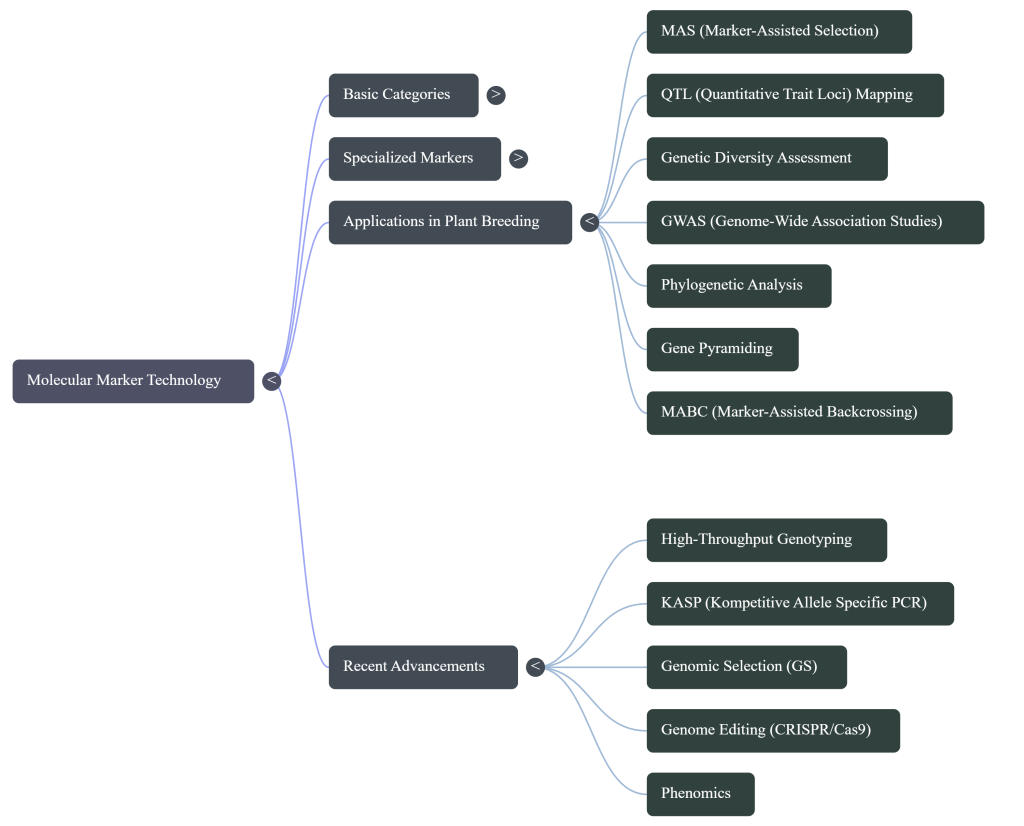
4. What is Marker-Assisted Selection in plant breeding?
Marker-assisted selection (MAS) is a powerful plant breeding technique that utilizes molecular markers to identify and select plants with desirable traits at the molecular level, even before those traits are physically visible. By using specific DNA sequences as “genetic landmarks,” breeders can predict the phenotype of a plant and make informed decisions about which individuals to continue breeding or discard.
Core Principles and Benefits
MAS serves as a high-precision complement to traditional breeding, offering several distinct advantages:
• Speed and Efficiency: It greatly expedites the breeding cycle by allowing for selection at the juvenile or seedling stage, rather than waiting generations for traits like fruit quality or adult disease resistance to express.
• Environmental Independence: Unlike traditional phenotypic selection, MAS is not confounded by environmental factors, soil conditions, or plant growth stages.
• Selection for Recessive Traits: Using codominant markers (like SSRs or SNPs) allows breeders to identify recessive alleles in a heterozygous state. This eliminates the need for time-consuming selfing or test-crossing to reveal hidden traits.
• Trait Pyramiding: MAS enables the simultaneous selection and “pyramiding” of multiple genes or Quantitative Trait Loci (QTLs) for different traits into a single variety, which is often difficult through physical observation alone.
The MAS Process
The implementation of MAS generally follows these key steps:
1. Marker Discovery: Researchers identify molecular markers (such as SNPs or SSRs) that are closely linked to target traits through genetic mapping or sequencing.
2. Marker Validation: Potential markers are tested across diverse genotypes to ensure they reliably and consistently predict the desired trait.
3. Screening and Selection: Validated markers are used to screen large breeding populations. Plants carrying the desired marker alleles are selected, while those without them are discarded early in the process.
4. Field Evaluation: Selected plants undergo traditional breeding evaluations to confirm their field performance and ensure they possess other necessary agronomic characteristics.
Common Applications
MAS is utilized across a wide range of crop improvement strategies:
• Disease and Pest Resistance: One of the earliest and most successful uses is developing crops resistant to pathogens, such as rice varieties resistant to bacterial blight using the Xa21 marker.
• Abiotic Stress Tolerance: Identifying markers for drought, salinity, and cold tolerance to create climate-resilient varieties.
• Quality Characteristics: Improving nutritional attributes, such as protein content in wheat, oil quality in canola, or fruit texture and taste.
• Marker-Assisted Backcrossing (MABC): This specialized scheme uses markers to rapidly transfer a specific trait from a donor parent into an elite “recipient” line while maintaining the recipient’s superior genetic background.
Limitations and Challenges
Despite its transformative potential, MAS faces several hurdles:
• Cost: The initial investment for high-throughput genotyping equipment, reagents, and specialized personnel can be significant.
• Complexity of Traits: While effective for major genes, MAS is more challenging for complex, polygenic traits (like yield) where many genes with small effects interact.
• Linkage Breakdown: The physical association between a marker and a target gene can sometimes break down over time due to genetic recombination, leading to false positives or negatives.
5. What is Marker-Assisted Backcrossing and how is it used?
Marker-assisted backcrossing (MABC) is a precision breeding technique that integrates molecular markers with traditional backcrossing to efficiently transfer one or a few desirable genes or Quantitative Trait Loci (QTLs) from a “donor” parent into an elite “recipient” parent. By using DNA markers to track the target trait, MABC significantly accelerates the breeding process compared to conventional methods.
Core Principles of MABC
MABC is designed to maintain the superior genetic background of the recipient (recurrent) parent while selectively introgressing a specific trait (e.g., disease resistance) from the donor. This is achieved through three levels of selection:
• Foreground Selection: Markers are used to identify and select plants that carry the target gene or QTL from the donor parent at each backcross generation.
• Background Selection: Markers unlinked to the target locus are used to select individuals with the highest proportion of the recurrent parent’s genome, accelerating the recovery of the elite background.
• Recombinant Selection: Markers flanking the target gene are used to select for recombination events that reduce the size of the donor chromosome segment, thereby minimizing “linkage drag” (the introduction of unwanted donor genes alongside the target trait).
The MABC Process
1. Selection of Parents: A superior “recurrent parent” (recipient) is chosen along with a “donor parent” that possesses the desired trait and linked molecular markers.
2. Initial Crossing: The two parents are crossed to produce the first generation of hybrids (F1).
3. Repeated Backcrossing: True F1 plants (confirmed by markers) are crossed back to the recurrent parent to produce the BC1F1 generation. This process is typically repeated for two to four generations (BC2,BC3,BC4) while continuously using markers to screen for the target trait.
4. Selfing and Fixation: After the final backcross, selected plants are self-pollinated to produce homozygous lines that carry the donor trait within the recovered recipient background.
5. Evaluation and Release: The resulting improved lines undergo field trials for agronomic and quality traits before being released as new varieties.
Key Applications and Advantages
MABC is particularly effective in the following scenarios:
• Introgressing Recessive Traits: It allows breeders to identify recessive alleles in a heterozygous state, eliminating the need for time-consuming progeny testing.
• Improving Complex Traits: It has been used to enhance yield-related traits by transferring specific chromosomal segments into elite lines.
• Disease Resistance: Successful examples include the development of rice varieties resistant to bacterial blight and blast, and maize varieties resistant to head smut.
• Abiotic Stress Tolerance: It has been used to create drought-tolerant maize by transferring drought-responsive genes into commercial lines.
• Time Savings: MABC can achieve in 3–4 generations what traditional backcrossing might take 6–8 generations to accomplish.
6. Can MAS be used for complex traits like crop yield?
Yes, Marker-Assisted Selection (MAS) can be used for complex traits like crop yield, though it is significantly more challenging than selecting for simple, monogenic traits. Yield is a polygenic (quantitative) trait, meaning it is controlled by many genes, each having a small individual effect.
While the application of MAS to yield is possible, the sources highlight specific strategies, successes, and the major hurdles involved:
1. Strategies for Complex Traits
Standard MAS is often less effective for highly complex characters governed by many genes. To address this, breeders use specialized schemes:
• Marker-Assisted Backcrossing (MABC): This has been used to transfer chromosomal segments associated with yield into elite lines. For example, MABC was successfully employed in maize to increase grain yield by 12–15%.
• Marker-Assisted Recurrent Selection (MARS): This approach is proposed for complex traits like yield as it allows for the accumulation of multiple favorable alleles across related populations through rapid cycles of recombination and selection.
• Genomic Selection (GS): Often described as an advanced form of MAS, GS is specifically designed for complex traits. Unlike traditional MAS, which focuses on a few major genes, GS uses high-density markers distributed across the entire genome to predict the breeding value of individuals, capturing both major and minor gene effects.
2. Major Challenges
The use of markers for yield improvement faces several limitations:
• Environmental Interaction (G×E): The expression of yield is heavily influenced by environmental conditions, which can reduce the efficiency of selection if the markers are not stable across different locations and years.
• Trait Complexity and Epistasis: Many genes controlling yield interact with each other (epistasis), which can skew the expected effect of a specific genetic marker.
• Small Effect Sizes: Many traits of interest are influenced by multiple genetic factors with small effects, making it difficult to identify individual loci that significantly impact the overall phenotype.
• Linkage Breakdown: Over time, the physical association between a marker and a target yield gene can break down due to genetic recombination, leading to false selections.
3. Practical Breeding Applications
In practice, because yield is so complex, breeders often focus on Quantitative Trait Loci (QTL) mapping to identify specific genomic regions with the largest influence on productivity.
• Yield Enhancement: Genetic markers associated with high yield potential have been used to accelerate the breeding of crops like rice, wheat, and maize, helping to address global food security concerns.
• Trait Pyramiding: MAS allows breeders to simultaneously select and “pyramid” multiple genes or QTLs for different traits (e.g., combining yield potential with disease resistance) into a single variety, which is extremely difficult to achieve through visual observation alone.
Summary: While traditional MAS is primarily used for simpler traits (like disease resistance), it remains a vital tool for yield improvement when used in conjunction with high-throughput genotyping, QTL mapping, and more advanced strategies like Genomic Selection.
7. What are the common limitations of using MAS in breeding?
While Marker-Assisted Selection (MAS) offers significant advantages in speed and precision, its implementation in breeding programs is hindered by several technical, economic, and practical limitations.
1. Technical and Biological Limitations
• Trait Complexity: MAS is highly effective for simply inherited traits (monogenic or oligogenic) but much less effective for complex, polygenic traits like yield, where many genes with small individual effects interact.
• Recombination and False Selection: The accuracy of MAS depends on the closeness of the linkage between the marker and the target gene; however, genetic recombination can occur between them over time. This leads to the breakdown of linkage disequilibrium, resulting in false positives or negatives during selection.
• Limited Transferability: Markers developed in one specific plant population may not be applicable to others due to differences in genetic backgrounds or a lack of marker polymorphism in narrow gene pools.
• Genetic Background Effects: The presence of a validated marker does not always guarantee the expression of the desired trait, as the overall genetic background of the plant can significantly impact gene expression.
• Genome Complexity: In species with large, complex polyploid genomes (such as wheat), the high frequency of repetitive sequences can increase the occurrence of genotyping errors.
2. Economic Challenges
• High Costs: The initial investment for specialized laboratory equipment (e.g., high-throughput genotyping platforms or real-time PCR machines for KASP), reagents, and personnel training is often prohibitive.
• Developmental Expenses: Isolating and validating new markers for non-model species is a time- and cost-intensive process.
• Prohibitive Scale: For large-scale breeding programs involving thousands of samples, the genotyping costs can exceed the budget of smaller programs or those in developing countries.
3. Logistical and Practical Hurdles
• Technical Expertise: Managing and interpreting the large datasets generated by modern sequencing and high-throughput genotyping requires advanced bioinformatics skills and specialized expertise.
• Time Requirements: Although MAS can speed up some stages, the initial discovery, validation, and verification of markers in different environments still require significant time and labor.
• Marker Accessibility: Not all molecular markers are “breeder-friendly“; some require conversion from complex formats (like RFLP or RAPD) into simpler, more reliable formats (like STS or SCAR) before they can be used effectively in the field.
• Ethical and Regulatory Issues: The use of markers associated with patented genes or technologies related to genetically modified organisms (GMOs) can raise ethical and regulatory challenges.
8. How do breeders use markers to reduce linkage drag?
Breeders use molecular markers to reduce linkage drag—the unintended introduction of undesirable donor genes alongside a target trait—primarily through a specialized technique called Marker-Assisted Backcrossing (MABC). While traditional backcrossing can take 6–8 generations to recover the elite parent’s genome, markers allow breeders to achieve this with high precision in just 3–4 generations.
Breeders utilize three specific levels of selection within MABC to minimize this drag:
1. Recombinant Selection (Flanking Markers)
This is the most direct method for reducing the size of the donor chromosome segment around the target gene.
• Mechanism: Breeders use flanking markers—DNA markers located on either side of the target gene.
• Goal: They identify “double recombinant” individuals that carry the desired gene but have undergone a crossover event at both flanking markers, replacing donor DNA with the recurrent parent’s DNA.
• Precision: The closer the flanking markers are to the gene (ideally <5 cM), the smaller the remaining donor segment and the less linkage drag is retained.
2. Background Selection
While recombinant selection focuses on the specific chromosome carrying the gene, background selection addresses the rest of the genome.
• Mechanism: Breeders use a set of markers (typically 2–4 per chromosome) distributed across the non-target chromosomes.
• Goal: They select offspring that have the highest percentage of the recurrent parent’s (RP) genome. This ensures that the improved variety retains the elite characteristics of the original variety without unwanted “background noise” from the donor.
3. Foreground Selection
Markers are used to confirm that the desired gene is actually present in each generation. This allows breeders to discard plants without the trait early in the process, ensuring that only those capable of producing the improved variety are used for further backcrossing or selfing.
Practical Challenges and Tools
• Population Size: Finding rare “double recombinants” requires large populations. Breeders often use specialized statistical software, such as Popmin, to calculate the minimum number of plants needed to guarantee finding at least one individual with the optimized genetic combination.
• Examples of Success: In tomato breeding, markers were used to drastically reduce donor segments around the Tm-2 resistance locus, which otherwise remained as large as 50 cM even after 11 generations of traditional backcrossing. In maize, MABC was used to shorten the donor region for the qHSR1 locus (head smut resistance) while recovering the high-yielding background of the recipient lines.
9. How does marker-assisted selection improve complex polygenic traits?
Improving complex polygenic traits through Marker-Assisted Selection (MAS) involves identifying and selecting specific genomic regions, known as Quantitative Trait Loci (QTLs), that contribute to characteristics like yield and abiotic stress tolerance. Unlike simple monogenic traits, complex traits are controlled by many genes with small individual effects and are heavily influenced by environmental factors.
MAS improves these traits using several specialized strategies:
1. Advanced Breeding Strategies
• Genomic Selection (GS): Regarded as an advanced form of MAS, GS uses high-density markers distributed across the entire genome to calculate Genomic Estimated Breeding Values (GEBVs). This approach is specifically designed for complex traits because it captures both major and minor gene effects simultaneously, allowing for selection without needing to observe the trait directly.
• Marker-Assisted Recurrent Selection (MARS): This scheme identifies multiple genomic regions involved in a complex trait to assemble the best-performing genotype within or across populations. It is particularly effective for “forward breeding” and allows for rapid cycles of recombination and selection to increase the frequency of favorable alleles.
• Marker-Assisted Backcrossing (MABC): MABC is used to transfer desirable QTLs from a donor parent into elite lines. In maize, for example, transferring six chromosomal segments associated with yield resulted in a 12–15% increase in grain yield.
• Trait Pyramiding: MAS enables breeders to simultaneously select and “pyramid” multiple genes or QTLs for different traits into a single variety. This is used to combine traits like high yield potential with durable disease resistance, which is difficult to achieve through visual observation alone.
2. Enhancing Breeding Efficiency
• Environmental Independence: Molecular markers are not affected by plant growth stages or environmental conditions, allowing for accurate selection regardless of field performance.
• Early Screening: Breeders can select plants at the juvenile or seedling stage, greatly reducing the generation time required before a phenotype is physically visible.
• Selection for Recessive Alleles: Using codominant markers (like SSRs or SNPs), MAS identifies recessive alleles in a heterozygous state. This eliminates the need for time-consuming progeny testing or selfing to reveal hidden traits.
3. Challenges in Polygenic Improvement
Despite its benefits, using MAS for complex traits faces significant hurdles:
• Environmental Interaction (G×E): The expression of quantitative traits is highly variable depending on the environment, which can make phenotyping and identifying stable markers difficult.
• Linkage Breakdown: Over time, the physical association between a marker and a target yield gene can break down due to genetic recombination, leading to selection errors.
• Small Effect Sizes: Identifying individual loci for complex traits is challenging because many traits are influenced by numerous genetic factors each having only a small impact on the overall phenotype.
10. What is the role of foreground and background selection?
In the context of Marker-Assisted Backcrossing (MABC), foreground and background selection are two complementary strategies used to efficiently transfer specific genes into an elite variety while maintaining that variety’s superior genetic makeup,.
Foreground Selection
The primary role of foreground selection is to identify and track the specific target gene or Quantitative Trait Locus (QTL) being transferred from the donor parent,.
• Mechanism: Breeders use molecular markers that are tightly linked to the gene of interest to screen the offspring at each backcross generation,.
• Purpose: It ensures that the desired trait (such as disease resistance or drought tolerance) is actually present in the selected plants,.
• Benefit: This is particularly valuable for recessive traits, which are invisible in the heterozygous state during backcrossing and would otherwise require time-consuming progeny testing to detect,.
Background Selection
The role of background selection is to accelerate the recovery of the recurrent parent’s (RP) elite genome and eliminate unwanted genetic material from the donor parent,.
• Mechanism: Breeders use a set of markers distributed across the entire genome (specifically on chromosomes not carrying the target gene) to select individuals with the highest percentage of the recurrent parent’s DNA,.
• Purpose: In traditional breeding, it takes 6–8 generations to fully recover the elite background; background selection can achieve the same result in just 3–4 generations,.
• Efficiency: This process is most efficient in later backcross generations (e.g., BC3) when the donor’s “background noise” has already been significantly reduced.
Related Concept: Recombinant Selection
Often used in conjunction with these two methods, recombinant selection (or “flanking selection”) uses markers located on either side of the target gene,. Its specific role is to identify rare crossover events that reduce the size of the donor chromosome segment surrounding the target gene, thereby minimizing linkage drag (the introduction of undesirable donor traits alongside the favorable gene),,.
Summary of Roles: | Selection Type | Primary Target | Main Objective | | :— | :— | :— | | Foreground | The specific gene/QTL | Ensure the desired trait is successfully transferred,. | | Background | The rest of the genome | Rapidly restore the original elite variety’s background,. | | Recombinant | The area near the gene | Minimize the “linkage drag” of unwanted donor DNA,. |
11. How do breeders use QTL mapping to find yield-related genes?
Breeders use Quantitative Trait Loci (QTL) mapping to identify specific genomic regions associated with complex, yield-related traits by statistically associating phenotypic data (physical measurements) with genotypic data (molecular markers). Because yield is a polygenic trait controlled by many genes with small individual effects, mapping these loci is essential for understanding its genetic architecture.
The process generally follows these fundamental steps:
1. Selection of Diverse Parents and Population Development
The first step involves choosing two parents that are genetically diverse enough to show significant variation in yield or its components (e.g., kernel weight or spike length). These parents are crossed to develop a mapping population, such as Recombinant Inbred Lines (RILs), Doubled Haploids (DHs), or F2 populations.
2. Comprehensive Phenotyping
Because yield is highly influenced by the environment, breeders must conduct precise phenotyping of the mapping population across multiple locations and seasons. This helps account for Genotype-by-Environment (G×E) interactions, ensuring that the identified yield genes are stable under different growing conditions.
3. Genotyping with Molecular Markers
Researchers screen the population using a set of polymorphic markers—such as SNPs, SSRs, or DArT—distributed across the entire genome. Modern platforms like Genotyping-by-Sequencing (GBS) or SNP arrays (e.g., the 660K array in wheat) allow for high-density genotyping, providing much better resolution than older methods.
4. Linkage Map Construction and QTL Detection
A genetic linkage map is constructed to show the relative positions and distances (in centimorgans) between markers based on how frequently they are inherited together during meiosis. Statistical methods—such as Composite Interval Mapping (CIM)—are then used to find significant correlations between specific marker clusters and the phenotypic yield data. If a marker and a trait consistently co-segregate, it indicates that a gene for yield is likely located near that marker.
5. Validation and Fine Mapping
Once a yield-related QTL is detected, it must be validated in different genetic backgrounds or environments, often using Near-Isogenic Lines (NILs). To isolate the specific gene, breeders may perform fine mapping or positional cloning, using larger populations (e.g., 3,000–4,000 plants) and higher marker density to narrow down the genetic interval.
Practical Applications for Yield
• Targeting Components: Breeders often map QTLs for yield components like Thousand Kernel Weight (TKW), as they are more stably inherited than overall grain yield.
• Trait Pyramiding: Once significant QTLs are found, breeders use Marker-Assisted Selection (MAS) to pyramid multiple favorable yield alleles into a single variety, which is difficult to achieve through traditional visual selection alone.
• Genomic Selection (GS): In advanced breeding, GS takes QTL mapping a step further by using thousands of markers to predict the Genomic Estimated Breeding Value (GEBV) of a plant for yield without needing to test it in the field first.
12. Can you explain marker-assisted backcrossing for trait introgression?
Marker-assisted backcrossing (MABC) is a precision breeding strategy that integrates molecular markers with traditional backcrossing to efficiently transfer specific genes or Quantitative Trait Loci (QTLs) from a donor parent into an elite “recipient” parent. This process, known as introgression, allows breeders to improve a single target trait in a superior variety while ensuring its original genetic background is fully restored.
The MABC Process
The procedure follows a systematic series of crosses and selections to reach a stable, improved line:
1. Parent Selection: An elite variety with high commercial value is chosen as the recurrent parent (RP), and a donor parent (DP) possessing the desired trait (e.g., disease resistance) and linked molecular markers is selected.
2. Initial Crossing: The two parents are crossed to produce the first generation of hybrids (F1).
3. Repeated Backcrossing: True F1 plants are crossed back to the RP to produce the BC1F1 generation. This backcrossing is typically repeated for two to four generations (BC2,BC3,BC4) while markers are used to screen the progeny at each step.
4. Selfing and Fixation: Once the desired trait is successfully introgressed and the background is recovered, the plants are self-pollinated to produce homozygous lines.
5. Evaluation: The improved lines undergo field trials to confirm their agronomic performance and quality before being released as new varieties.
Three Levels of Selection
MABC utilizes three distinct types of marker-based selection to maximize precision and speed:
• Foreground Selection: Markers are used to identify and track the presence of the specific target gene or QTL from the donor parent at each generation. This is critical for recessive traits, which are invisible in the heterozygous state.
• Background Selection: Breeders use markers distributed throughout the rest of the genome to select individuals that have the highest percentage of the recurrent parent’s elite genome. This accelerates the recovery of the elite background, achieving in 3–4 generations what traditional methods take 6–8 generations to accomplish.
• Recombinant Selection: Using markers that “flank” the target gene, breeders identify crossover events that reduce the size of the donor chromosome segment. This minimizes linkage drag, or the introduction of unwanted donor genes alongside the desired trait.
Key Advantages and Applications
MABC is particularly valuable when traditional phenotypic selection is difficult, such as when dealing with traits expressed late in plant development or those highly influenced by the environment. Successful applications include:
• Rice: Introgressing genes for bacterial blight and blast resistance into elite high-yielding cultivars.
• Maize: Transferring drought-responsive genes into commercial lines and incorporating Bt transgenes for insect resistance.
• Wheat: Rapidly transferring rust and dough quality loci into susceptible elite lines, cutting development time from 12 years to just five.
• Quality Traits: Introgression of the low gluten locus (Lgc−1) in rice and the opaque2 gene for high lysine in corn.
13. What is trait pyramiding and why is it useful?
Trait pyramiding (also known as gene pyramiding) is a specialized breeding technique that involves simultaneously integrating multiple genes or Quantitative Trait Loci (QTLs) for one or more target traits into a single elite plant variety. While traditional breeding often focuses on a single gene at a time, pyramiding uses molecular markers to assemble a “stack” of beneficial alleles that would be difficult or impossible to combine through visual selection alone.
Why Trait Pyramiding Is Useful
Trait pyramiding is primarily used to enhance the performance, durability, and adaptability of crops. Its key benefits include:
• Durable Disease and Pest Resistance: This is the most common application. By combining multiple resistance genes (e.g., for bacterial blight in rice or rust in wheat), breeders can create “durable” resistance that is much harder for pathogens to overcome through mutation. If a pathogen breaks one resistance gene, the others in the “pyramid” remain effective.
• Improvement of Complex Traits: For polygenic traits like crop yield or abiotic stress tolerance, pyramiding allows breeders to accumulate multiple favorable QTLs—each contributing a small positive effect—into a single variety to significantly boost overall performance.
• Efficiency in Selection: Molecular markers allow breeders to confirm the presence of multiple genes in the same plant without needing to observe the physical trait (phenotype) for each gene individually. This is especially useful when one gene might “mask” the effect of others during field testing.
• Trait Stacking: It enables the simultaneous improvement of entirely different categories of traits, such as combining high yield potential with superior grain quality and multi-pathogen resistance.
Methods of Pyramiding
Breeders typically use several strategies to achieve a pyramid:
• Marker-Assisted Backcrossing (MABC) Schemes: These include stepwise transfer (one gene at a time), simultaneous transfer (all genes at once, requiring very large populations), or convergent backcrossing (transferring genes into separate lines and then crossing those lines together), which is often the most balanced and preferred approach.
• Marker-Assisted Recurrent Selection (MARS): A scheme designed to assemble the best-performing genotypes by identifying and selecting multiple genomic regions involved in complex traits across rapid cycles of recombination.
Successful Examples
• Rice: Pyramiding multiple Xa genes has resulted in varieties with broad-spectrum resistance to bacterial leaf blight and blast.
• Wheat: Breeders have successfully pyramided genes for Fusarium head blight (FHB) resistance with genes for rust resistance and dough quality, significantly shortening the time to develop commercial cultivars.
• Barley: Pyramiding a single major stripe rust resistance gene with multiple QTLs has provided enhanced quantitative resistance.
14. What are the specific steps in marker-assisted backcrossing?
Marker-assisted backcrossing (MABC) is a precision breeding technique that integrates molecular markers with traditional backcrossing to efficiently transfer one or a few desirable genes or Quantitative Trait Loci (QTLs) from a donor parent into an elite recipient parent while maintaining the recipient’s superior genetic background.
The process generally follows these specific steps:
1. Planning and Parent Selection
• Trait Identification: Breeders identify a specific desirable trait (e.g., disease resistance, drought tolerance) to be introduced.
• Marker Selection: Polymorphic molecular markers (such as SNPs, SSRs, or AFLPs) that are tightly linked to the target trait are chosen.
• Selection of Parents:
◦ Donor Parent (DP): The source of the desired trait and linked markers.
◦ Recipient (Recurrent) Parent (RP): An elite or commercially valuable variety that will serve as the genetic background for the improved line.
2. Initial Crossing and Hybridization
• The donor parent is crossed with the recipient parent to produce the first generation of hybrids (F1).
• Verification: True F1 plants are identified using markers to eliminate any false hybrids before proceeding.
3. Repeated Backcrossing and Selection
Selected F1 plants are crossed back to the recipient parent to produce the BC1F1 generation. This backcrossing process is typically repeated for two to four generations (BC2,BC3,BC4). During these cycles, markers are used for three levels of selection:
• Foreground Selection: Markers are used at each generation to identify and select plants that carry the specific target gene or QTL from the donor. This is especially useful for tracking recessive traits in a heterozygous state.
• Background Selection: Markers unlinked to the target locus are used to select individuals with the highest proportion of the recipient parent’s genome. This achieves in 3–4 generations what traditional backcrossing takes 6–8 generations to accomplish.
• Recombinant Selection: Markers “flanking” the target gene are used to select for crossover events that reduce the size of the donor chromosome segment, thereby minimizing “linkage drag” (unwanted donor genes attached to the target trait).
4. Selfing and Fixation
• After the final backcross generation (e.g., BC4), the selected plants are self-pollinated to produce homozygous lines.
• Molecular markers are used to identify and harvest individuals that are homozygous for the donor parent’s trait allele.
5. Final Evaluation and Release
• Throughout the process, genotyping confirms the presence of the trait and monitors the recovery of the recipient’s genetic material.
• The resulting improved lines undergo extensive field trials to evaluate yield, quality, and resistance standards.
• Once standards are met, the lines are released as new improved varieties.
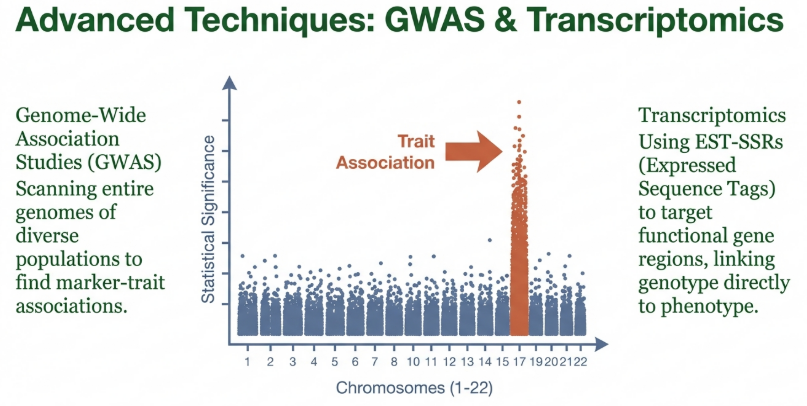
15. How do transcriptome-based markers reveal gene expression variations?
Transcriptome-based markers reveal gene expression variations by analyzing the transcriptome (the set of all RNA molecules) rather than the genome, primarily using complementary DNA (cDNA) synthesized from messenger RNA (mRNA) as a template. This approach allows researchers to treat differences in the sequence or quantity of mRNA produced as “alleles,” providing a direct look at the molecular basis of biological responses.
These markers reveal variations through several specialized techniques:
• cDNA-AFLP (Transcript Profiling): This technique displays differentially expressed genes by digesting cDNA with restriction enzymes and selectively amplifying the fragments. It is highly sensitive, capable of detecting low-abundance transcripts and distinguishing between highly homologous genes from the same family that traditional microarrays might miss.
• RAP-PCR (RNA Fingerprinting by Arbitrarily Primed PCR): This method fingerprints RNA populations using arbitrary primers to detect tissue-specific differences in expression, as well as sequence polymorphisms that are useful for genetic mapping.
• ESTs (Expressed Sequence Tags): ESTs are partial sequences of cDNA that identify genes expressed in specific tissues at specific times. They are instrumental in discovering genes associated with developmental stages, such as the transition from vegetative to reproductive stages in plants.
• cDNA-SSCP: This technique evaluates the presence and relative quantity of transcripts. It is powerful enough to reliably separate and analyze duplicated transcripts with 99% sequence identity, which is particularly useful for gain insight into gene silencing in polyploid genomes.
• NGS (Next-Generation Sequencing): Modern sequencing facilitates a much deeper analysis of expression, making it possible to identify rare transcripts, alternative splice variants, and expressed mutations.
By focusing on the transcribed regions of the genome, these markers provide essential data for understanding gene function and regulation, especially in response to environmental stresses or during different growth stages. Unlike random DNA markers, these functional markers target the polymorphisms within the gene sequences themselves that directly affect the plant’s phenotype.
16. What is Genomic Selection and how does it compare to MAS?
Genomic Selection (GS) is an advanced form of marker-assisted breeding that leverages genetic information from an organism’s entire genome to predict its potential performance and select the best individuals for breeding. Unlike traditional selection methods, it uses genome-wide marker data to calculate Genomic Estimated Breeding Values (GEBVs), allowing breeders to estimate the genetic potential of an individual without having to observe the physical trait directly.
How Genomic Selection Works
The GS process is divided into a training phase and a breeding phase:
1. Training Population: A diverse group of individuals (a subset of the population) is selected to undergo both genotyping (typically using high-density SNPs) and extensive phenotyping (measuring traits like yield or quality).
2. Model Training: Statistical methods are used to associate the dense marker data with the phenotypic data to build a predictive model.
3. Breeding Phase: The model is applied to a larger “testing” population that has been genotyped but not phenotyped.
4. Selection: Individuals with the highest GEBVs are selected as parents for the next generation. This accelerates the cycle because selection can occur at the seedling stage.
Comparison: Genomic Selection vs. Marker-Assisted Selection (MAS)
While both techniques use molecular markers to improve breeding efficiency, they differ fundamentally in scope and application:
| Feature | Marker-Assisted Selection (MAS) | Genomic Selection (GS) |
|---|---|---|
| Selection Target | Targets a few specific markers linked to major genes or QTLs. | Targets thousands of markers distributed across the entire genome. |
| Trait Complexity | Highly effective for simple, monogenic traits (e.g., disease resistance). | Specifically designed for complex, polygenic traits (e.g., yield). |
| Gene Effects | Focuses on major gene effects; often misses minor genes. | Captures both major and minor gene effects simultaneously. |
| Mapping Requirements | Requires prior QTL mapping to identify marker-trait associations. | Can avoid QTL mapping; selection is based on the whole-genome prediction alone. |
| Prediction Accuracy | Accuracy depends on the tightness of linkage to a specific locus. | Generally offers higher accuracy for complex traits by accounting for all genetic variation. |
Advantages and Practical Considerations
• Addressing Complexity: GS is more effective than MAS for traits like grain yield in maize and wheat, where many genes with small individual effects contribute to the phenotype.
• Efficiency: Studies in crops like oil palm show that GS can be superior to other selection methods in terms of genetic gain per unit of cost and time.
• Current Challenges: Despite its potential, GS is not yet a universal standard. The statistical models can be difficult for breeders to interpret, and the high cost of high-density genotyping can be a barrier for smaller programs or those in developing countries.
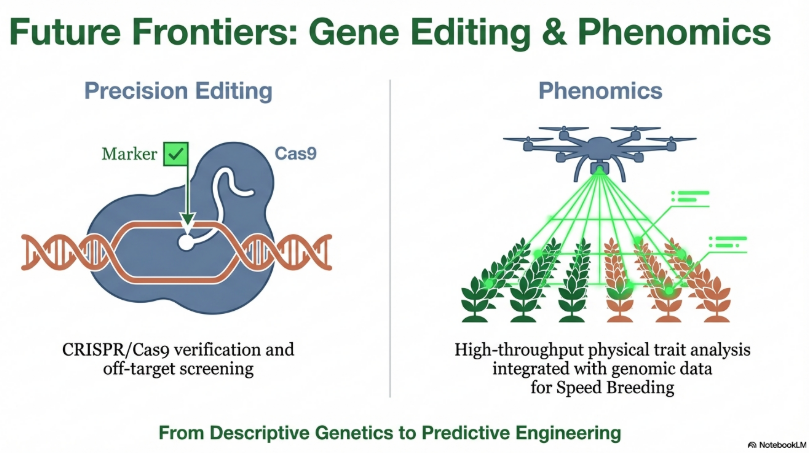
• Integration with New Tech: Recent trends suggest that combining GS with genome editing (CRISPR) could further revolutionize breeding by directly improving unfavorable alleles and then using GS to handle the recombination of adapted alleles.
17. What are QTLs and how are they mapped using markers?
Quantitative Trait Loci (QTLs) are specific regions of the genome that contain genes influencing quantitative (polygenic) traits, such as yield, plant height, or nutritional content. Unlike qualitative traits that show discrete variation (e.g., flower color), quantitative traits exhibit continuous variation because they are controlled by multiple genes, each contributing a small effect, and are often heavily influenced by the environment.
How QTLs Are Mapped Using Markers
QTL mapping is a statistical method that associates phenotypic data (physical measurements) with genotypic data (molecular markers) to identify the genetic basis of trait variation. The process involves several critical steps:
1. Selection of Diverse Parents: Researchers choose two parents that are genetically diverse enough to show significant differences in the target trait and exhibit high levels of marker polymorphism.
2. Mapping Population Development: The parents are crossed to create a segregating population where genes and markers are shuffled through recombination. Common population types include F2 populations, Recombinant Inbred Lines (RILs), Doubled Haploids (DHs), and Backcross (BC) populations.
3. Phenotyping and Genotyping:
◦ Phenotyping: Individuals in the mapping population are evaluated for the trait of interest (e.g., measuring grain weight or disease severity).
◦ Genotyping: The same individuals are screened with a set of molecular markers (such as SNPs or SSRs) distributed across the entire genome.
4. Linkage Map Construction: A genetic map is built to show the relative positions and distances between markers based on their recombination frequency during meiosis. Tightly linked markers are inherited together more frequently.
5. Statistical Analysis and Detection: Software tools use statistical models (e.g., Simple Interval Mapping or Composite Interval Mapping) to find correlations between specific markers and the phenotypic data. If a marker consistently co-segregates with a trait, it indicates that a QTL is located near that marker.
6. Significance and Validation:
◦ LOD Score: The Logarithm of Odds (LOD) ratio is used to determine the significance of a linkage; a LOD score greater than 3 is generally considered ideal for constructing linkage maps.
◦ Validation: Identified QTLs must be validated in different genetic backgrounds or environments to ensure their reliability for use in Marker-Assisted Selection (MAS).
Role of Molecular Markers
Molecular markers act as “genetic landmarks” or flags on the chromosomes. Because they are not affected by environmental conditions or plant growth stages, they allow breeders to identify and select for complex traits at the molecular level, even before the physical traits are visible. Tightly linked markers (located within <5 cM of the QTL) are preferred to minimize the risk of recombination breaking the association between the marker and the target gene.
18. How do breeders use SNPs to pyramids resistance genes?
Breeders use Single Nucleotide Polymorphisms (SNPs) to pyramid resistance genes by identifying high-density molecular markers tightly linked to multiple genes and using high-throughput genotyping platforms to select individuals that carry the full “stack” of beneficial alleles.
The Role of SNPs in Pyramiding
Single Nucleotide Polymorphisms (SNPs) are ideal for gene pyramiding—the simultaneous integration of multiple genes or Quantitative Trait Loci (QTLs) into a single variety—due to several key characteristics:
• High Abundance and Density: As the most abundant type of genetic variation, SNPs provide a vast number of potential markers distributed throughout the genome, allowing for the identification of markers extremely close to specific resistance genes.
• Codominant Inheritance: SNPs allow breeders to distinguish between homozygous and heterozygous states, which is critical for tracking multiple genes across generations.
• High-Throughput Automation: SNP analysis is easily automated using platforms like SNP arrays and Next-Generation Sequencing (NGS), making it practicable to select for many genes simultaneously in large breeding populations.
Technical Workflow for SNP-Based Pyramiding
The process typically involves moving from broad marker discovery to precise selection:
1. Marker Discovery and Validation: Researchers identify SNPs linked to resistance genes through Genome-Wide Association Studies (GWAS) or QTL mapping. These associations are then validated across diverse genotypes to ensure they consistently predict resistance.
2. Conversion to “Breeder-Friendly” Assays: Linked SNPs are often converted into cost-effective, flexible assays such as KASP (Kompetitive Allele Specific PCR) or STARP (Semi-thermal asymmetric reverse PCR).
3. Multiplexed Genotyping: Platforms like KASP allow for multiplexed screening, where several markers for different resistance genes are analyzed in a single assay.
4. Selection and Stacking: Breeders screen segregating populations at the seedling stage and select individuals carrying the favorable SNP alleles for all targeted resistance genes.
Overcoming Traditional Breeding Barriers
Using SNPs for pyramiding solves several challenges inherent in traditional phenotypic selection:
• The Masking Problem: In traditional breeding, one highly effective resistance gene can “mask” the presence of others during field testing. SNP markers allow breeders to confirm the presence of every gene in the stack regardless of whether their individual effects are visible.
• Environmental Independence: SNP-based selection is not confounded by environmental factors, allowing breeders to identify resistant plants without needing to wait for a natural disease outbreak or perform artificial inoculations.
• Selection for Recessive Alleles: Codominant SNP markers allow for the selection of recessive resistance genes in a heterozygous state, eliminating the need for time-consuming selfing or progeny testing.
Practical Examples
• Wheat: Breeders have successfully used KASP and STARP markers to pyramid genes for Fusarium head blight (FHB) resistance (like Fhb1) with multiple genes for rust and powdery mildew resistance.
• Rice: Pyramiding of Xa genes using molecular markers has led to varieties with broad-spectrum and durable resistance to bacterial leaf blight.
19. How can markers help improve resistance to disease and pests?
Molecular markers have revolutionized breeding for resistance by acting as “genetic landmarks” that allow researchers to identify, track, and select for desirable genes at the molecular level, often before physical symptoms or traits are even visible.
According to the sources, markers improve resistance to diseases and pests through the following key strategies:
1. Marker-Assisted Selection (MAS)
MAS is a powerful technique that allows breeders to select plants carrying resistance genes based on their DNA profile rather than relying solely on physical observation.
• Early Screening: Breeders can screen plants at the juvenile or seedling stage, enabling them to identify and discard susceptible plants early, which saves significant time and resources.
• Environmental Independence: Unlike traditional phenotypic selection, which requires a natural disease outbreak or artificial inoculation, markers are not affected by environmental conditions. Selection can occur in greenhouses or off-season nurseries regardless of the pathogen’s presence.
• Identifying Recessive Genes: Markers (especially codominant ones like SSRs and SNPs) can identify recessive resistance alleles in a heterozygous state. This eliminates the need for time-consuming progeny testing or selfing that would otherwise be required to reveal hidden traits.
2. Trait Pyramiding (Gene Pyramiding)
This involves the simultaneous integration of multiple resistance genes or Quantitative Trait Loci (QTLs) into a single plant variety.
• Durable Resistance: Combining multiple genes for the same trait makes it much harder for pathogens or pests to overcome the plant’s defenses through mutation.
• Overcoming the Masking Problem: In traditional breeding, one highly effective gene may “mask” the presence of others. Markers allow breeders to confirm that every gene in the stack is actually present, which is nearly impossible through visual observation alone.
3. Marker-Assisted Backcrossing (MABC)
MABC is used to efficiently transfer specific resistance genes (introgression) from a “donor” (often a wild relative) into an elite “recipient” line while maintaining the recipient’s superior agronomic performance.
• Precision and Speed: Markers allow for foreground selection (tracking the target gene) and background selection (recovering the elite parent’s genome), reducing the time needed to develop a resistant variety from 6–8 generations to just 3–4 generations.
• Linkage Drag Reduction: Breeders use “flanking markers” on either side of a resistance gene to perform recombinant selection, which minimizes the amount of unwanted donor DNA (linkage drag) that is transferred alongside the gene.
4. Utilization of Wild and Alien Genes
Wild plant species often possess rich genetic diversity for resistance because they have adapted to survive harsh environmental stresses without human intervention.
• Introgression of Alien Genes: Markers facilitate the transfer of beneficial resistance genes from wild or related species into cultivated varieties, such as incorporating wheat rust resistance from wild relatives.
• Mapping New Loci: Techniques like Genotyping-by-Sequencing (GBS) and transcriptome-based markers are used to discover and map novel resistance genes in non-model or wild species.
Successful Examples Highlighted in the Sources
• Rice: Pyramiding multiple Xa genes for broad-spectrum and durable resistance to bacterial leaf blight and blast.
• Wheat: Identifying and introgressing the major QTL Fhb1 for Fusarium head blight (FHB) resistance.
• Maize: Transferring the major QTL qHSR1 for resistance to head smut into high-yielding inbred lines.
• Soybean: Using the Satt309 marker to accurately select for soybean cyst nematode resistance.
• Cotton: Identifying the presence of Bt toxin genes for insect resistance.
20. What are the common challenges when using MAS for yield?
Using Marker-Assisted Selection (MAS) for complex traits like crop yield is significantly more difficult than for simple, monogenic traits due to several biological, technical, and economic hurdles.
Common challenges identified in the sources include:
1. Polygenic Inheritance and Small Gene Effects
Yield is a quantitative (polygenic) trait, meaning it is controlled by many genes, each contributing only a small individual effect to the overall phenotype.
• Difficulty in Detection: Because many genes are involved and their individual impacts are minor, identifying individual loci or Quantitative Trait Loci (QTLs) that significantly affect the trait is a major hurdle.
• Low Heritability: Quantitative traits often have lower heritability, which decreases the relative efficiency of MAS compared to traits controlled by major genes.
2. Environmental Interactions (G×E)
The expression of yield is heavily influenced by the environment, making the association between a marker and a phenotype unstable.
• Phenotyping Difficulty: Strong QTL-environment interactions mean that a gene’s effect may vary significantly between locations or years, complicating the discovery of reliable markers.
• Requirement for Validation: Because of this variability, QTLs must be verified across multiple environments before they can be effectively used in breeding programs.
3. Biological and Genetic Hurdles
• Epistasis: Genes controlling yield often interact with one another (epistasis), which can lead to skewed or unpredictable results when attempting to select for specific QTLs.
• Linkage Breakdown: Effectiveness is diminished if the marker and the target gene become uncoupled due to genetic recombination over many cycles of meiosis.
• Genetic Background Effects: A marker validated in one population may not be transferable to another due to different genetic backgrounds or a lack of marker polymorphism in narrow gene pools.
4. Technical and Logistical Complexity
• Large Population Sizes: The number of individuals needed in a breeding population increases exponentially with the number of target loci. Selecting for many yield-related QTLs simultaneously is often considered “almost impossible” due to resource and facility limitations.
• Inaccurate Phenotyping: A core reason breeding goals for yield are sometimes not met is inaccurate phenotyping, which prevents the precise correlation of genotype with phenotype.
• Statistical Challenges: Deficiencies in statistical analysis can lead to the overestimation or underestimation of the number of genes involved and their actual effects.
5. Economic Constraints
• High Costs: Implementing MAS for yield requires a significant initial investment in high-throughput genotyping equipment, reagents, and specialized personnel.
• Resource Intensity: The need for repeated field tests over multiple locations and seasons to accurately characterize QTL effects adds substantial labor and expense.
21. What role does CRISPR play in modern marker-assisted breeding?
In modern marker-assisted breeding, CRISPR (Clustered Regularly Interspaced Short Palindromic Repeats) serves as a precision tool that works alongside molecular markers to directly modify traits and expedite the breeding cycle,. It represents a “paradigm shift” by moving from just selecting existing variation to creating or improving it,.
The role of CRISPR in this field is characterized by the following key functions:
1. Direct Allelic Improvement
Unlike traditional breeding, which relies on crossing plants to shuffle existing genes, CRISPR facilitates the direct improvement of less favorable alleles into more favorable ones. By modifying specific genetic traits at a single locus, breeders can introduce desirable characteristics—such as herbicide resistance or biotic/abiotic stress tolerance—without the extensive reshuffling associated with conventional crosses,.
2. Integration with Genomic Selection (GS)
CRISPR is increasingly used in conjunction with Genomic Selection (GS) to create a more powerful crop improvement strategy.
• Shortening Backcrossing: Genome editing significantly shortens the time required for backcrossing between elite varieties and exotic germplasm. Exotic germplasm often contains “ancient alleles” for resistance, and CRISPR can be used to introgress these specific traits directly.
• Recombination Management: Once CRISPR has improved the target alleles, Genomic Selection is applied to handle the recombination of adapted alleles, ensuring the resulting variety maintains its overall elite performance.
3. Precision Breeding and Tracking
In the context of Precision Breeding, molecular markers play a critical supportive role for CRISPR operations:
• Tracking Edited Genes: Markers are used to identify and track the successfully edited genes through subsequent generations.
• Quality Control: Markers ensure the absence of unintended modifications (off-target effects), providing a layer of verification for the precision of the genome edit.
4. Development of Advanced Genotyping Methods
The precision and efficiency of the CRISPR-Cas system have also been harnessed to develop new genotyping methods. These novel strategies are cost-effective, sequence-specific, and allow for the accurate multiplexing of small insertions/deletions (InDels) and Single Nucleotide Polymorphisms (SNPs) that are characteristic of edited alleles.
5. Research and Gene Discovery
CRISPR is a vital tool in functional genomics, helping researchers decipher the roles of specific genes. By “knocking out” or modifying a gene and observing the resulting phenotype, scientists can identify which specific DNA sequences should be targeted by future molecular markers in breeding programs,. This technology has already been applied successfully in major crops like maize and wheat.
22. How do GBS and SNP arrays compare in cost and speed?
Both Genotyping-by-Sequencing (GBS) and SNP arrays are advanced, high-throughput technologies used to analyze genetic variation, but they differ significantly in their financial requirements and operational speed.
Cost Comparison
The sources generally characterize GBS as a more cost-effective approach, particularly for initial discovery and large-scale applications, while SNP arrays often involve higher initial investments.
• Genotyping-by-Sequencing (GBS): GBS is a “reduced representation” sequencing method that lowers costs by sequencing only a subset of the genome near specific restriction sites. It utilizes multiplexing, where unique DNA barcodes are added to multiple samples so they can be pooled and sequenced in a single run, significantly reducing the cost per sample. Additionally, GBS avoids ascertainment bias because it does not require prior knowledge of the genome or specific SNPs, eliminating the expensive and time-consuming process of marker development required for arrays.
• SNP Arrays: These platforms often have high start-up and developmental costs. While the cost per analysis for an established array can be relatively low, the initial investment in specialized equipment, reagents, and probe design is a significant barrier for smaller breeding programs. In crops with large, complex genomes like wheat, whole-genome sequencing (WGS) remains expensive, making arrays a frequent but costly alternative to cover gene-coding regions.
Speed and Throughput
Both technologies are categorized as “ultra-high-throughput” and are significantly faster than traditional methods like SSRs or RFLPs.
• Speed of Detection: SNP arrays are praised for being easily automated and quickly detected. Once an array is developed, large populations can be scanned rapidly with high and powerful call rates.
• Genotyping Throughput: GBS is often rated as having “Very High” throughput compared to the “High” throughput of traditional SNP platforms. Because GBS combines the discovery of new markers and the genotyping of samples into a shorter, single-step procedure, it can accelerate the overall research cycle.
• Suitability for Non-Model Species: GBS is much faster to implement for species without extensive prior genomic information because it does not depend on a reference genome to construct genetic linkage maps. In contrast, SNP arrays require a lengthy development phase to identify and immobilized thousands to millions of SNP probes.
Summary of Comparison
| Feature | Genotyping-by-Sequencing (GBS) | SNP Arrays |
|---|---|---|
| Development Cost | Medium; no prior SNP knowledge needed. | High; significant investment to identify and design probes. |
| Running Cost | Low to Medium; reduced by multiplexing. | Low per analysis once developed, but equipment is expensive. |
| Speed/Time | Rapid; combines discovery and genotyping. | Fast detection and low time demand for existing arrays. |
| Throughput | Very High. | High. |
| Automation | High. | High; very easily automated. |
23. What are the advantages of using chloroplast and mitochondrial microsatellites?
Using chloroplast microsatellites (cpSSRs) and mitochondrial microsatellites (mtSSRs) offers several distinct advantages in plant research, particularly because they provide genetic information that is complementary to the data obtained from the nuclear genome.
Key Advantages of Chloroplast Microsatellites (cpSSRs)
Chloroplast microsatellites are ubiquitous and highly polymorphic components of chloroplast DNA that serve as high-resolution tools for studying cytoplasmic variation. Their primary advantages include:
• Uniparental Inheritance: Because they follow a uniparental mode of transmission (typically maternal in angiosperms and sometimes paternal in conifers), they exhibit different patterns of genetic differentiation compared to nuclear alleles.
• Revealing Past Demographic Patterns: cpSSRs can uncover genetic discontinuities and distinctiveness between taxa with slight morphological differences that nuclear DNA markers might miss, especially when past interbreeding or genetic exchange has obscured demographic history.
• Broad Phylogenetic Comparison: The high conservation and homology of sequences in the chloroplast genome allow researchers to compare genes across the entire plant kingdom and examine relationships in taxa that diverged millions of years ago.
• High Polymorphism and Easy Genotyping: While the chloroplast genome generally has a low mutation rate, cpSSRs provide higher polymorphism levels and are easier to genotype than other chloroplast sequence variations.
• Mapping Mating Systems and Gene Flow: They are particularly effective markers for studying mating systems, gene flow through both pollen and seeds, and uniparental lineages.
• Detection of Hybridization: cpSSRs are frequently used to detect hybridization and introgression events in various plant populations.
• Linked Loci: Because the chloroplast chromosome is a non-recombinant molecule, all cpSSR loci are linked, which simplifies some genetic analyses.
Key Advantages of Mitochondrial Microsatellites (mtSSRs)
While plant mitochondrial DNA (mtDNA) is complex and characterized by frequent sequence reorganization, its microsatellites offer specialized benefits:
• Parental Lineage Identification: Like chloroplast markers, mtSSRs help elucidate parental lineages, which is of immense help in both breeding and evolutionary genetics.
• Population Differentiation: Mitochondrial haplotype diversity, often related to sequence rearrangements, is useful for distinguishing between closely related populations, such as in pine and fir taxa.
• Trait-Based Segregation: Mitochondrial repeats have been successfully utilized for trait-based segregation within specific populations.
Summary of General Benefits
By combining organelle microsatellites with nuclear markers, researchers gain a comprehensive understanding of plant population differentiation and evolution. These markers reveal unique genetic variations through increased genome coverage, helping scientists understand the molecular basis of biological responses and developmental programming.
24. How are markers used to improve environmental stress tolerance?
Molecular markers are used to improve environmental stress tolerance by identifying and selecting specific genomic regions, known as Quantitative Trait Loci (QTLs), that contribute to a plant’s ability to adapt to challenging conditions. These markers act as “genetic landmarks” that allow breeders to pinpoint the genetic basis of adaptability to factors such as drought, salinity, heat, and cold.
The sources describe several specific ways markers are applied for this purpose:
1. Advanced Breeding Strategies
• Marker-Assisted Selection (MAS): Breeders can select plants carrying stress-tolerance genes at the molecular level, even before those traits are physically expressed. This is particularly useful because selection is not affected by environmental factors, allowing for consistent results regardless of field conditions.
• Marker-Assisted Backcrossing (MABC): This technique is used to efficiently transfer drought-responsive genes or other stress-related QTLs from a donor parent into commercially valuable elite lines. A notable success includes the development of drought-tolerant maize varieties through the introgression of these specific genes.
• Genomic Selection (GS): GS uses markers distributed across the entire genome to predict a plant’s performance under stress. It has been successfully used to create predictive models for drought tolerance in maize, enabling the selection of individuals that can thrive in water-limited environments.
• Trait Pyramiding: Breeders use markers to simultaneously integrate multiple genes or QTLs for stress tolerance into a single variety. This “stacking” of favorable alleles results in plants with significantly enhanced performance and adaptability to various environmental challenges.
2. Gene Discovery and Functional Analysis
• QTL Mapping: By analyzing the association between molecular markers and phenotypic measurements, researchers can identify specific genomic regions that influence complex traits like reproduction-stage drought tolerance in rice or yield under drought in wheat.
• Functional and Transcriptomic Markers: These markers target the functional polymorphisms within gene sequences that directly affect a plant’s phenotype. Transcriptome-based markers are particularly valuable for understanding how gene expression and regulation change in response to environmental biological stresses.
• Hitchhiking Mapping: Genome-wide screens use markers (often microsatellites) to identify chromosomal regions that bear the “signature of selection,” helping to locate genes that have evolved for better environmental adaptation.
3. Utilization of Wild Genetic Resources
Wild plant species serve as an essential “encyclopedia” of ancient alleles for resistance because they have adapted to survive harsh natural conditions without human intervention. Markers facilitate the introgression of these beneficial traits—such as salt tolerance or winter hardiness—from wild or related species into cultivated crop varieties.
4. Integration with Modern Technologies
• Genome Editing (CRISPR): Molecular markers play a critical role in tracking successfully edited genes (e.g., for herbicide or abiotic stress tolerance) and ensuring the absence of unintended modifications during the breeding process.
• High-Throughput Phenotyping (HTPP): To improve stress tolerance, breeders must accurately correlate genotypes with phenotypes. Advanced markers are used alongside HTPP tools like cameras and sensors to collect precise data on complex traits under environmental stress.
25. Tell me about the different types of GBS techniques
Based on the sources, Genotyping-by-Sequencing (GBS) is a high-throughput, next-generation sequencing (NGS)-based approach that sequences subsets of a genome to reveal genetic variations within a population at a reduced cost. It is a “reduced representation” method, meaning it reduces the complexity of large genomes by focusing on specific regions.
The sources identify two primary types of GBS techniques and several related NGS-based platforms:
1. Two Main GBS Techniques (Ion PGM Based)
According to the sources, there are two techniques categorized by their usage on platforms like the Ion PGM system:
• Digestion of Restriction Enzymes: This method is primarily used in marker-assisted selection (MAS) programs to identify new markers. In this approach, DNA is digested with one or two specific restriction enzymes before the ligation of adapters, but specific SNPs are not initially identified.
• Multiplex Enrichment PCR: This technique uses specific PCR primers to amplify specific points of interest. Unlike the digestion method, this approach identifies a complete set of SNPs for a targeted genome section.
2. Related NGS-Based Platforms
Other high-throughput platforms function similarly to GBS or are used for the same genotyping purposes:
• Restriction-Site Associated DNA Sequencing (RAD-Seq): This method uses restriction enzymes to selectively sequence DNA fragments adjacent to recognition sites. It is particularly effective for detecting Single Nucleotide Polymorphisms (SNPs).
• Specific-Locus Amplified Fragment Sequencing (SLAF-Seq): This platform combines reduced representation libraries with NGS to identify and genotype SNPs.
3. Core Mechanism of GBS
Regardless of the specific type, the GBS process generally follows these steps:
• Library Preparation: DNA is extracted and digested with restriction enzymes.
• Multiplexing: Unique DNA barcodes (indexes) are added to each sample, allowing many individuals to be sequenced simultaneously in a single run.
• Fragment Selection: DNA fragments are size-selected to target specific regions or markers, such as SNPs.
• Amplification and Sequencing: The selected fragments are amplified via PCR and sequenced using NGS technologies.
Key Advantages
GBS techniques are widely used in modern breeding because they are cost-effective and rapid. A major benefit is that they do not require prior genome information (such as a reference genome) for constructing genetic linkage maps, making them suitable for both well-characterized and non-model species. They have been successfully applied to map genes for disease resistance, yield, and nutritional content in various crops.
26. How do breeders use markers for selection and gene pyramiding?
Breeders use molecular markers to identify, track, and stack desirable genes with a level of precision and speed that is impossible through traditional phenotypic selection. By acting as genetic landmarks, these markers allow breeders to select superior plants at the molecular level, even before physical traits are expressed.
1. How Markers Are Used for Selection
The use of markers for selection, known as Marker-Assisted Selection (MAS), integrates DNA marker detection into traditional breeding programs.
• Early Generation Screening: Markers allow for selection at the seedling or juvenile stage. This enables breeders to discard undesirable plants immediately, saving significant time, labor, and greenhouse space.
• Environmental Independence: Unlike traditional selection, which often requires specific conditions (like a disease outbreak) to observe a trait, marker results are consistent regardless of the environment or plant growth stage.
• Tracking Hidden Traits: Markers are particularly useful for identifying recessive genes in a heterozygous state. In traditional breeding, these traits are “invisible” and would otherwise require time-consuming progeny testing to reveal.
• Selection Tiers in Backcrossing: In Marker-Assisted Backcrossing (MABC), breeders use three levels of selection to precisely introgress genes:
◦ Foreground Selection: Identifying and tracking the specific target gene from the donor parent.
◦ Background Selection: Selecting individuals with the highest percentage of the recurrent parent’s elite genome to restore the variety’s superior traits quickly.
◦ Recombinant Selection: Using markers that flank the target gene to identify crossover events that reduce the donor chromosome segment, thereby minimizing “linkage drag” (unwanted donor genes).
2. How Markers Are Used for Gene Pyramiding
Gene pyramiding is the simultaneous integration of multiple genes or Quantitative Trait Loci (QTLs) into a single elite variety.
• Overcoming the “Masking” Problem: In traditional breeding, a single highly effective resistance gene can “mask” the presence of others, making it impossible to tell if a plant carries one gene or a stack of them. Markers allow breeders to confirm that every gene in the stack is present.
• Achieving Durable Resistance: Pyramiding is most often used to combine multiple resistance genes (e.g., against bacterial blight in rice or rust in wheat). This creates “durable” resistance that is much harder for pathogens to overcome through mutation.
• Pyramiding Schemes:
◦ Stepwise Transfer: Introgressing genes one at a time over successive generations; this is precise but slow.
◦ Simultaneous/Synchronized Transfer: Crossing multiple lines to create a single hybrid carrying all target genes in one step; this is the fastest but requires very large populations.
◦ Convergent Backcrossing: Genes are transferred into separate lines of the recurrent parent, and those improved lines are then crossed together to form the final pyramid.
• Marker-Assisted Recurrent Selection (MARS): For complex traits like yield, breeders use MARS to identify multiple genomic regions and assemble the best-performing genotypes through rapid cycles of recombination and selection.
3. Practical Breeding Impacts
The application of markers has drastically shortened the breeding cycle for many crops. For example, by using MAS and doubled haploid technology, breeders developed a commercial wheat cultivar with improved rust resistance and dough quality in five years, compared to the 12 years typically required for conventional breeding. Successful examples include pyramiding Xa genes in rice for broad-spectrum resistance to bacterial leaf blight and introgressing the major QTL Fhb1 for Fusarium head blight resistance in wheat.
27. How do breeders decide between using GBS or SNP arrays?
Breeders decide between Genotyping-by-Sequencing (GBS) and SNP arrays based on the target species’ genomic knowledge, the specific objectives of the breeding program, and the available financial and technical resources. Both are ultra-high-throughput technologies used to identify genetic variations, but they offer different advantages and limitations.
1. Genomic Knowledge and Species Type
• Non-Model and Wild Species: GBS is often the preferred choice for non-model species or wild relatives because it does not require a reference genome or prior knowledge of specific SNPs to construct genetic linkage maps.
• Well-Characterized Species: SNP arrays are typically used for well-studied crops (like rice, maize, and wheat) where thousands to millions of SNP probes have already been identified and immobilized on a solid chip.
2. Cost and Resource Availability
• Development and Startup Costs: SNP arrays involve high initial development and startup costs for probe design and specialized equipment. GBS is generally more cost-effective for initial discovery because it combines marker discovery and genotyping into a single step without the need for expensive array design.
• Running Costs: While GBS has lower entry costs, SNP arrays can provide a low cost per analysis once the platform is established, though the required laboratory equipment remains expensive.
3. Data Quality and Precision
• Call Rates and Accuracy: SNP arrays are favored for their high and powerful call rates and robust allele calling. GBS data can be more prone to errors resulting from low read coverage, which can lead to a poor capacity to identify true homozygotes.
• Genome Complexity: In species with large, complex genomes like hexaploid wheat, GBS performance is highly dependent on the quality of the reference genome, and the high frequency of homoeologous sequences can increase genotyping errors.
4. Flexibility and Automation
• Customization: GBS is highly flexible and discovers new SNPs and other genetic variants in real-time. SNP arrays are flexible regarding sample customization but have low efficiency and high costs for changing the actual SNP markers on the chip once it is manufactured.
• Speed and Automation: SNP arrays are easily automated and quickly detected, making them efficient for screening very large populations.
Summary of Decision Factors
| Feature | Genotyping-by-Sequencing (GBS) | SNP Arrays |
|---|---|---|
| Prior Sequence Info | Not required | High requirement |
| Ideal Application | SNP discovery, non-model species | Standardized high-density genotyping |
| Startup Cost | Low to Moderate | High |
| Data Reliability | High (but can have errors in large genomes) | Very High (robust allele calling) |
| Automation | High | Very High |
In practice, breeders often use both technologies together to discover loci for traits of interest, utilizing GBS for discovery and arrays for high-density, routine screening.
28. How does pyramiding multiple resistance genes help prevent pathogen mutations?
Pyramiding multiple resistance genes helps prevent pathogen breakthroughs by creating a multi-layered defense system that is significantly more difficult for a pathogen to overcome through single mutations. In traditional breeding, a single highly effective resistance gene can often be bypassed by a pathogen through a relatively simple mutation event,.
According to the sources, pyramiding provides the following protections:
• Reduction of Resistance-Breaking Probabilities: Combining numerous sources of resistance in the same cultivar reduces the mathematical probability of a pathogen acquiring the multiple, specific mutations necessary to overcome all the stacked resistance mechanisms simultaneously.
• Durable and Stable Resistance: This approach is specifically used to achieve what breeders call “durable” or stable disease resistance,. While a pathogen might evolve to defeat one gene in the pyramid, the remaining genes continue to provide protection, effectively “trapping” the pathogen and preventing a total loss of resistance.
• Broad-Spectrum Protection: Pyramiding allows for the simultaneous integration of multiple genes or Quantitative Trait Loci (QTLs) targeting either different strains of the same pathogen or multiple different pathogens entirely,. For example, in rice, pyramids have been successfully developed against both bacterial blight and blast.
• Overcoming the “Masking” Effect: One major advantage of using molecular markers for pyramiding is that they allow breeders to confirm the presence of all genes in the stack. In traditional phenotypic selection, one very strong resistance gene might “mask” the effect of others, making it impossible to tell if the plant has a single gene or a full pyramid without molecular tools,.
By using techniques like Marker-Assisted Gene Pyramiding (MAGP), breeders can ensure that a new variety carries a robust suite of defenses, ensuring that the resistance remains effective in the field for a much longer period than a single-gene variety,.
What are the advantages of exome capture genotyping?
Based on the sources, exome capture genotyping is a high-throughput sequencing approach that focuses exclusively on the protein-coding regions (exons) of the genome,. This strategy offers several specific advantages, particularly for complex crop species:
• Cost-Effectiveness: While advances in Next-Generation Sequencing (NGS) have made whole-genome sequencing (WGS) possible, WGS remains prohibitively expensive for organisms with large and complex genomes, such as wheat. Exome capture provides a more affordable alternative by sequencing only the gene-coding portions of the genome, which typically represent a small fraction of the total DNA,.
• Facilitating Gene Discovery: Because the variants identified through this method are located within coding sequences, they provide direct information about potential changes in gene function. This makes it much easier to identify the causative genes responsible for specific traits compared to using random molecular markers.
• Accelerated Trait Mapping: Traditional forward mapping is a lengthy, multi-step process that requires identifying linked markers and then sequencing candidate genes across broad genetic regions. Techniques like bulked segregant exome capture sequencing (BSE-Seq) can bypass these steps to map mutant genes much more rapidly.
• Precision in Genomic Selection: Along with other NGS-based technologies, exome capture provides an effective and accurate means to perform genomic selection and targeted gene identification, helping breeders make more informed decisions during the selection process.
In summary, exome capture genotyping allows researchers to focus their resources on the most functional parts of the genome, significantly increasing the efficiency and speed of target gene discovery while reducing costs,.
What are the benefits of using cytoplasmic markers?
Using cytoplasmic markers—specifically those derived from chloroplast DNA (cpDNA) and mitochondrial DNA (mtDNA)—provides plant breeders and ecologists with genetic information that is complementary to the nuclear genome, offering unique insights into population structure, evolutionary history, and inheritance patterns.
The primary benefits of using these organelle markers include:
1. Uniparental Inheritance and Lineage Tracking
• Maternal/Paternal Insights: Unlike nuclear DNA, which is biparentally inherited, cytoplasmic genomes typically follow a uniparental mode of transmission. In most angiosperms, both chloroplasts and mitochondria are maternally inherited, whereas in some conifers, chloroplast DNA can show a paternal pattern.
• Tracking Ancestry: This mode of inheritance allows researchers to trace uniparental lineages without the “shuffling” effect of recombination, making them effective for studying parentage and ancestral origins.
2. High Resolution for Closely Related Taxa
• Revealing Hidden Differences: Chloroplast markers can uncover genetic discontinuities and distinctiveness between taxa that appear morphologically identical or that nuclear markers cannot distinguish because past interbreeding has obscured demographic patterns.
• Ecotype Identification: These markers are highly informative for the recognition of ecotypes and studying intraspecific biogeography.
3. Superiority in Phylogenetic and Evolutionary Studies
• Long-term Evolutionary History: Due to high conservation and homology in the chloroplast genome, these markers allow scientists to compare genes across the entire plant kingdom and examine relationships in taxa that diverged millions of years ago.
• Simple and Stable Nature: The stable genetic nature of the chloroplast genome makes it an ideal marker for evaluating plant phylogeny.
4. Detection of Hybridization and Introgression
• Identifying Cytoplasmic Capture: Comparing chloroplast and nuclear phylogenies often reveals cases of cytoplasmic introgression that occurred without detectable nuclear introgression.
• Hybrid Analysis: These markers can distinguish between parental genotypes in hybrid swarms, identifying whether a plant is an F1 hybrid or a backcross based on its mitochondrial or chloroplast source.
5. Efficient Analysis of Gene Flow and Mating Systems
• Pollen vs. Seed Flow: Because they can be inherited differently, organelle markers are particularly effective for studying gene flow via both pollen and seeds, as well as complex mating systems.
• Ease of Genotyping: Chloroplast microsatellites (cpSSRs) offer higher polymorphism levels and are easier to genotype than many other chloroplast variations, providing a high-resolution tool for examining cytoplasmic variation.
6. Unique Genomic Characteristics
• Non-Recombinant Loci: The chloroplast chromosome is a non-recombinant molecule, meaning all cpSSR loci are linked, which simplifies certain types of genetic analysis.
• Trait-Based Segregation: Mitochondrial repeats have been successfully used for trait-based segregation of populations, such as distinguishing specific cytoplasmic male sterile lines from their maintainer lines.
How does BSE-Seq speed up the gene mapping process?
Bulked segregant exome capture sequencing (BSE-Seq) speeds up the gene mapping process by combining the efficiency of Bulked Segregant Analysis (BSA) with the precision of exome capture technology. This integrated approach allows researchers to bypass the traditional, multi-step hurdles of forward mapping to identify causative genes directly.
According to the sources, BSE-Seq accelerates mapping through the following mechanisms:
• Elimination of Multi-Step Procedures: Traditional forward mapping is a lengthy process that requires first identifying linked markers and then sequencing numerous candidate genes across broad genetic regions. BSE-Seq simplifies this into a more direct procedure.
• Focus on Protein-Coding Regions: By focusing exclusively on the exome (the protein-coding exons), the identified genetic variants provide immediate information about potential changes in gene function. This makes it significantly easier to find the causative genes responsible for a trait compared to using random molecular markers distributed across non-coding regions.
• Complexity Reduction for Large Genomes: For crops with massive and complex genomes, such as wheat (16 Gb), Whole Genome Sequencing (WGS) is prohibitively expensive and computationally demanding. BSE-Seq serves as a cost-effective alternative by sequencing only the functional fraction of the genome while still providing adequate coverage to identify variants.
• Rapid Mapping in Segregating Populations: The technique uses “bulked segregant pools”—grouping individuals from a population that show contrasting versions of a trait. Sequencing these pools allows for the rapid identification of the specific genomic interval where the target gene is located.
Practical Application The sources highlight that BSE-Seq was successfully used to quickly map a specific mutant gene in wheat, the yellow leaf mutant gene ygl1, demonstrating its power in accelerating trait discovery in complex species.
29. What are the benefits of multiplexing functional markers in breeding?
Multiplexing functional markers (FMs)—the process of combining several markers into a single assay—offers significant advantages in modern plant and animal breeding by enhancing the speed, precision, and economic viability of selection programs.
The primary benefits of multiplexing functional markers include:
1. Increased Precision and Effectiveness
Shifting from uniplex (one marker at a time) to multiplex systems allows for more effective and precise results in Marker-Assisted Selection (MAS). This is particularly useful when targeting multiple desirable traits or alleles across segregating progenies, ensuring that the selection process is both accurate and comprehensive.
2. Significant Cost Reduction
Multiplexing is a major driver of cost-effectiveness in breeding:
• Analytical Costs: It decreases analytical costs by allowing multiple markers to be processed in a single PCR or gel electrophoresis run.
• Specific Platforms: Advanced techniques like KASP (Kompetitive Allele Specific PCR) are cited as being particularly low-cost compared to traditional assays when used in a multiplexed format.
• Resource Conservation: It reduces sample consumption, which is critical when working with limited amounts of tissue or high-value DNA samples.
3. Time Efficiency
Multiplexed assays are time-saving, significantly accelerating the timeframe required to achieve breeding goals. By identifying multiple loci in parallel, breeders can make selection decisions much faster than if they were evaluating each marker individually.
4. Higher Throughput and Simultaneous Selection
Multiplexing facilitates ultra-high-throughput genotyping, which is necessary for screening very large populations.
• It allows for the simultaneous study of several loci in a single reaction, making it an ideal tool for complex breeding objectives like gene pyramiding or trait stacking.
• Platforms like liquid chips or probe-in-solution sequencing (GBTS) leverage multiplexing to capture random positions and lengths across the genome efficiently.
5. Improved Data Utility and Sharing
Multiplexed markers are considered a feature of ideal genetic markers because they allow data to be accumulated and shared easily between laboratories. This collaborative potential helps standardize breeding protocols and verify results across different environments or populations.
6. Enhanced Performance
For certain marker classes, such as AFLPs, the ability to multiplex increases their performance considerably, allowing for a high “multiplex ratio” where 50–100 loci can be reliably identified in a single reaction.
30. How is DNA barcoding used to identify new species?
DNA barcoding is a molecular technique that uses a short, standardized DNA sequence from a specific region of the genome to identify and classify species. Its essential aim is to facilitate large-scale screening of reference genes to assign unknown individuals to known species and enhance the discovery of new ones.
According to the sources, here is how DNA barcoding is used in species identification:
The Mechanism of Identification
• Reference Gene Screening: Taxonomists use a common sequence as a “barcode” for comparison. In animals, the standard region is the mitochondrial cytochrome c oxidase I (COI) gene.
• Assignment and Discovery: By comparing the DNA sequence of an unknown specimen against a database of reference genes, researchers can either assign it to an existing species or identify it as a potentially new, previously undescribed species.
• High Accuracy: This method is highly precise, with a reported accuracy rate of 97.9%, providing a quick and convenient strategy for assessing genetic diversity.
Applications in Research
• Biological Taxonomy: DNA barcoding has shifted the field toward “DNA taxonomy,” allowing for the classification of organisms based on molecular data rather than just physical characteristics.
• Plant Phylogeny: While COI is the standard for animals, research in plants often utilizes highly variable chloroplast markers for DNA barcoding and evaluating evolutionary relationships at low taxonomic levels.
Limitations and Challenges
Despite its efficiency, the sources note several challenges with this approach:
• Conservative Sequences: Some genome fragments used as barcodes are relatively conservative and may not possess enough variation to distinguish between closely related species.
• Variable Evolution Rates: In some organisms, the COI sequence evolves too slowly to be useful for identification.
• Maternal Bias: Because COI is a mitochondrial sequence, it is typically of maternal origin, which can create a bias in species diversity assessments if hybridization has occurred.
References
Agarwal, M., Shrivastava, N., & Padh, H. (2008). Advances in molecular marker techniques and their applications in plant sciences. In Plant Cell Reports (Vol. 27, Number 4, pp. 617–631). https://doi.org/10.1007/s00299-008-0507-z
Al-Samarai, F. R., & Al-Kazaz, A. A. (2015). Molecular Markers: an Introduction and Applications. European Journal of Molecular Biotechnology, 9(3), 118–130. https://doi.org/10.13187/ejmb.2015.9.118
BACHMANN, K. (1994). Molecular markers in plant ecology. New Phytologist, 126(3), 403–418. https://doi.org/10.1111/j.1469-8137.1994.tb04242.x
Dhutmal, R. R., Mundhe, A. G., & More, A. W. (2018). Molecular Marker Techniques: A Review. In Int.J.Curr.Microbiol.App.Sci (Number 6). http://www.ijcmas.com
Garrido-Cardenas, J. A., Mesa-Valle, C., & Manzano-Agugliaro, F. (2018). Trends in plant research using molecular markers. In Planta (Vol. 247, Number 3, pp. 543–557). Springer Verlag. https://doi.org/10.1007/s00425-017-2829-y
Grover, A., & Sharma, P. C. (2016). Development and use of molecular markers: Past and present. In Critical Reviews in Biotechnology (Vol. 36, Number 2, pp. 290–302). Taylor and Francis Ltd. https://doi.org/10.3109/07388551.2014.959891
Gupta, P. K., Arshney, R. K. V, & Prasad, M. O. (2002). 2 MOLECULAR MARKERS: PRINCIPLES AND METHODOLOGY.
Gupta, P. K., Varshney, R. K., Sharma, P. C., & Ramesh, B. (1999). Molecular markers and their applications in wheat breeding. In Plant Breeding (Vol. 118, Number 5, pp. 369–390). https://doi.org/10.1046/j.1439-0523.1999.00401.x
Jiang, G.-L. (2013). Molecular Markers and Marker-Assisted Breeding in Plants. In Plant Breeding from Laboratories to Fields. InTech. https://doi.org/10.5772/52583
Kamal Meena, V., Vardhan Singh Shekhawat, H., Chand, S., Choudhary, K., Kumar Sharma, J., & Lekha, L. (2023). Advances in Molecular Marker Technology and their Significance in Plant Improvement Strategies. In Recent Trends in Plant Breeding and Genetic Improvement. IntechOpen. https://doi.org/10.5772/intechopen.1002773
Marwal, A., & Gaur, R. K. (2020). Molecular markers: Tool for genetic analysis. In Animal Biotechnology: Models in Discovery and Translation (pp. 353–372). Elsevier. https://doi.org/10.1016/B978-0-12-811710-1.00016-1
Marwal, A., Sahu, A. K., & Gaur, R. K. (2013). Molecular Markers: Tool for Genetic Analysis. In Animal Biotechnology: Models in Discovery and Translation (pp. 289–305). Elsevier Inc. https://doi.org/10.1016/B978-0-12-416002-6.00016-X
Mirzaei, S. (2021). Application of molecular markers in plant sciences; An overview. Central Asian Journal of Plant Science Innovation, 1(4), 192–200. https://doi.org/10.22034/CAJPSI.2021.04.02
Nadeem, M. A., Nawaz, M. A., Shahid, M. Q., Doğan, Y., Comertpay, G., Yıldız, M., Hatipoğlu, R., Ahmad, F., Alsaleh, A., Labhane, N., Özkan, H., Chung, G., & Baloch, F. S. (2018). DNA molecular markers in plant breeding: current status and recent advancements in genomic selection and genome editing. In Biotechnology and Biotechnological Equipment (Vol. 32, Number 2, pp. 261–285). Taylor and Francis Ltd. https://doi.org/10.1080/13102818.2017.1400401
Özbek, Ö. (2024). Molecular Markers Used to Reveal Genetic Diversity and Phylogenetic Relationships in Crop Plants. In OBM Genetics (Vol. 8, Number 4, pp. 1–25). LIDSEN Publishing Inc. https://doi.org/10.21926/obm.genet.2404274
Schlötterer, C. (2004). The evolution of molecular markers – just a matter of fashion? Nature Reviews Genetics, 5. www.nature.com/reviews/genetics
Schulman, A. H. (2007). Molecular markers to assess genetic diversity. Euphytica, 158(3), 313–321. https://doi.org/10.1007/s10681-006-9282-5
Song, L., Wang, R., Yang, X., Zhang, A., & Liu, D. (2023). Molecular Markers and Their Applications in Marker-Assisted Selection (MAS) in Bread Wheat (Triticum aestivum L.). In Agriculture (Switzerland) (Vol. 13, Number 3). MDPI. https://doi.org/10.3390/agriculture13030642
Yali, W. (2022). Molecular Markers: Their Importance, Types, and Applications in Modern Agriculture. Agriculture, Forestry and Fisheries, 11(1), 8. https://doi.org/10.11648/j.aff.20221101.12
Related posts:
 Restriction Fragment Length Polymorphism (RFLP): Comprehensive Analysis of Molecular Markers in Genetic Mapping, Species Identification, and Clinical Diagnostics
 The Comprehensive Guide to Amplified Fragment Length Polymorphism (AFLP): A Precision Tool for DNA Fingerprinting and Genotyping
 The Secret of the Blue and White Colonies: An Introduction to Blue-White Screening
 The Genetic Engineer’s Toolkit: A Beginner’s Guide to Cloning Vectors
 Polymerase Chain Reaction (PCR): The Molecular Copier That Revolutionized Modern Science

