1. Introduction to AFLP Technology
In the landscape of molecular genetics, Amplified Fragment Length Polymorphism (AFLP) represents a sophisticated synthesis of restriction-based and amplification-based technologies. Developed in the early 1990s by Pieter Vos and colleagues at KeyGene N.V., this PCR-based tool provides a powerful solution for high-resolution genomic analysis without the need for prior sequence knowledge.

Amplified Fragment Length Polymorphism is a highly sensitive method used for DNA fingerprinting and genotyping. It detects genomic variation caused by single-nucleotide polymorphisms (SNPs) or insertions/deletions (INDELs) that create or abolish restriction endonuclease recognition sites. Crucially, while the name implies a focus on length, the resulting data are scored as presence-absence polymorphisms (binary data). This provides a comprehensive genomic “barcode” rather than a measure of a single locus length, offering an unparalleled view of an organism’s genetic architecture.

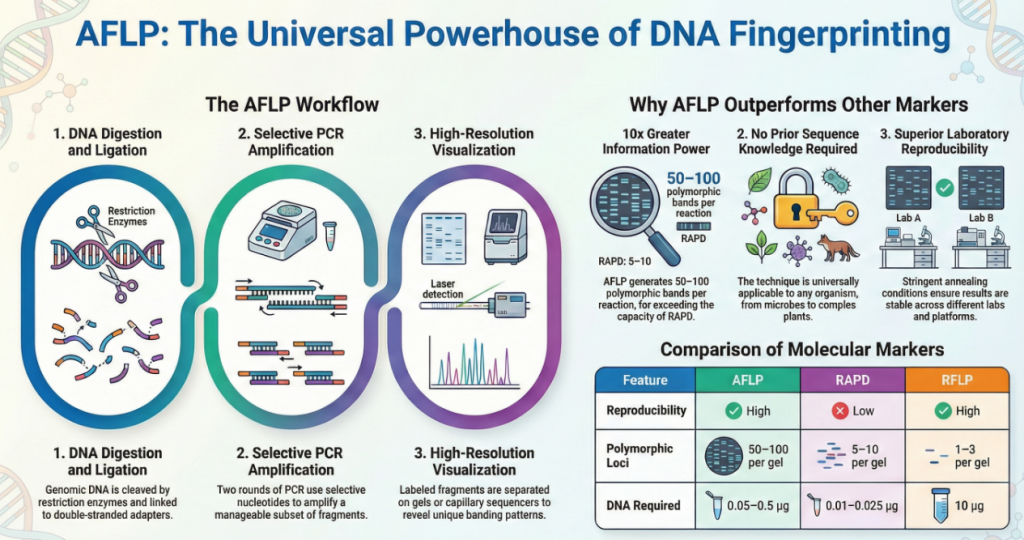
Strategically, AFLP bridges the critical gap between the high sensitivity of Random Amplified Polymorphic DNA (RAPD) and the high reproducibility of Restriction Fragment Length Polymorphism (RFLP). Unlike protein markers, AFLP markers are not subject to environmental influences and cover the entire genome. By combining the power of restriction enzyme digestion with the flexibility of PCR, AFLP allows for the simultaneous detection of polymorphisms across various genomic regions, making it essential for genetic mapping, species identification, and systematics.

AFLP offers distinct advantages over SSRs (microsatellites) and RFLPs. The primary differentiator—and a massive boon to research efficiency—is that AFLP requires no prior sequence knowledge of the target organism. While SSRs require expensive genome sequencing and primer design, AFLP utilizes universal primers and adaptors. This makes it exceptionally efficient for non-model organisms, allowing investigators to generate thousands of markers rapidly across any genome without preliminary investment in sequence data.
The robustness of AFLP is derived from its stringent selection process, which systematically filters genomic complexity to produce a legible and highly reproducible fingerprint. This is achieved through a meticulous five-step workflow that remains the gold standard for mapping unknown genomes.
Table 1: Strategic Evaluation of AFLP (Strengths vs. Constraints)
| Feature | Description and Impact | Strategic Impact for Research Directors |
|---|---|---|
| Marker Type | Dominant Nature: Scores the presence (1) or absence (0) of fragments. | Requires proprietary technology for heterozygote scoring; otherwise, allele frequencies are estimated. |
| Multiplex Ratio | High Capacity: Capable of amplifying 50–100 distinct bands (from 100–300 total fingerprints). | Maximizes data throughput per reaction; ideal for large-scale germplasm screening. |
| Reproducibility | High Stringency: Stringent PCR and high melting temperatures minimize experimental error (<2%). | Ensures inter-laboratory consistency and reliable database establishment. |
| Template Requirement | DNA Quality: Requires high-molecular-weight, pure genomic DNA. | Necessitates optimized extraction; poor template leads to incomplete digestion and “pseudo-polymorphism.” |
| Prior Knowledge | Universal Compatibility: No requirement for prior sequence data. | Dramatically reduces lead time for researching non-model or wild species. |
The 3 most important advantages of AFLP for a researcher include:
• Universal Applicability and Minimal Sample Requirements: It works on any organism without a genetic map. Critically, it requires very low amounts of DNA (as little as 500 ng), allowing us to fingerprint tiny organisms or even single spores.
• Superior Reproducibility: Unlike RAPD, which can be fickle, AFLP uses highly stringent PCR conditions. This ensures that a fingerprint generated in a lab in Nairobi is identical to one generated in New York.
• Massive Data Output: A single reaction can generate 50 to 100 polymorphic markers and up to 300 total fragments, providing a high-resolution snapshot of the entire genome simultaneously.
To transform raw genomic material into this digital barcode, the DNA must pass through a specialized five-step molecular cycle designed to “filter” complexity into clarity.
2. The Five-Step AFLP Procedural Workflow
The strategic logic of the AFLP workflow is complexity reduction. By systematically filtering a total genomic digest down to a manageable set of 50–100 distinct fragments, researchers can achieve high-resolution visualization without the chaotic “smearing” typical of less selective techniques.

Step 1: Genomic DNA Digestion
The process begins with the simultaneous digestion of genomic DNA using a “rare cutter” (6-base pair recognition, typically EcoRI) and a “frequent cutter” (4-base pair recognition, typically MseI). For animal genomes, the combination of EcoRI and TaqI is often substituted to optimize fragment distribution.
• Specialist Insight: Complete digestion is the cornerstone of a reliable fingerprint. Any uncut fragments will be amplified in later steps, leading to experimental artifacts. From a bench-side perspective, one must account for buffer compatibility. If the enzymes require different conditions, a sequential digestion is performed (rare cutter first), followed by buffer adjustment or DNA recovery via precipitation before the second enzyme is added.

Restriction Reaction Protocol
For a 20 µl reaction, use 500 ng of high-quality DNA.
1. Simultaneous Digestion: If buffer conditions are compatible, add both enzymes (excess enzyme is recommended) and incubate.
2. Incompatibility Management: If buffers differ, perform digestion with the rare cutter first. The DNA must then be recovered via precipitation and resuspended in the buffer appropriate for the second enzyme.
3. Risk Mitigation: Be wary of “star activity” due to non-standard conditions and DNA methylation, both of which hinder endonuclease activity and produce incomplete digests.
| Enzyme Category | Recognition Sequence Length | Frequency of Cut / Purpose |
|---|---|---|
| Rare Cutter (e.g., EcoRI) | 6 base pairs (5′-GAATTC-3′) | Cuts less frequently; serves as the primary “anchor” and labeling site for the fingerprint. |
| Frequent Cutter (e.g., MseI) | 4 base pairs (5′-TTAA-3′) | Cuts very frequently; ensures fragments are small enough (80–500 bp) for efficient PCR. |
Step 2: Ligation of Adaptors
Double-stranded synthetic adaptors are ligated to the sticky ends of the fragments. These adaptors provide known sequences for universal PCR priming.
| Adaptor Component | Functional Role |
|---|---|
| Core Sequence | A standardized sequence that enables universal priming regardless of the internal genomic sequence. |
| Enzyme-Specific Sequence | Matches the unique overhangs (e.g., EcoRI or MseI) left by the restriction enzymes. |
| Ligation Site Modification | Designed to destroy the original restriction site, preventing re-cleavage by the enzymes during or after ligation. |
Adaptor Ligation and Strategic Value
Synthetic double-stranded adaptors are ligated to the overhangs.
• Irreversibility: Ligation destroys the original restriction site, preventing re-cleavage and allowing simultaneous restriction-ligation if desired.
• Universal Priming: These “tags” provide known sequences at the ends of unknown fragments for universal primer binding.

Step 3: Pre-selective Amplification
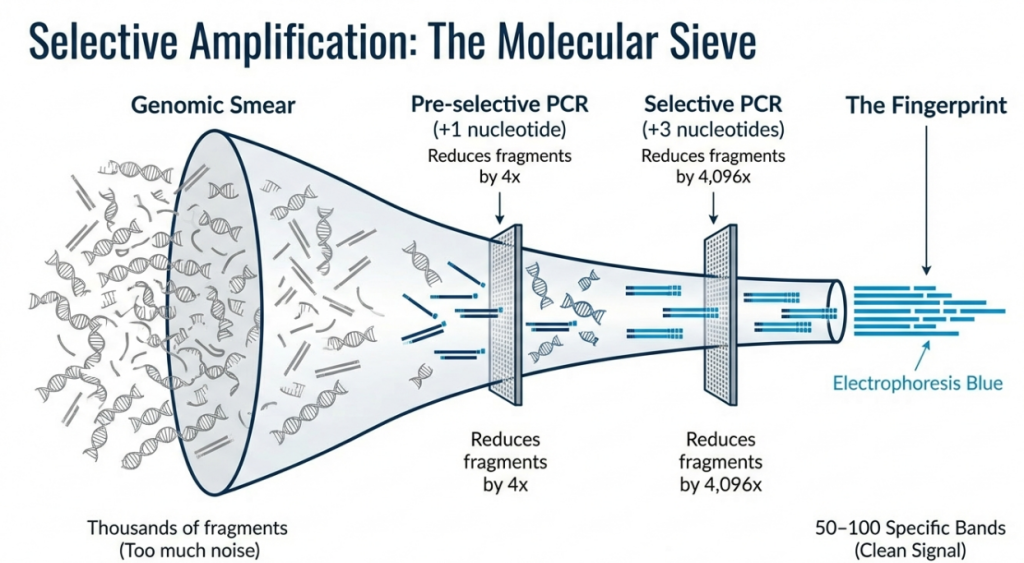
Primers complementary to the adaptors, featuring a single selective nucleotide (e.g., +A) at the 3’ end, are used. Mathematically, this single-base extension reduces the amplified fragment population by a factor of 4. High-stringency conditions ensure only perfect matches are elongated.
• Complexity Reduction: The complexity is reduced through a logic of powers of 4. Since there are four possible DNA bases (A, T, C, G), each selective nucleotide added to a primer reduces the number of amplified fragments by a factor of 4 (4n):
• 1 base: 41 = 4x reduction.
• 2 bases: 42 = 16x reduction.
• 3 bases: 43 = 64x reduction.
Using 3-bp extensions allows for 128 possible subsets of genomic DNA to be amplified.

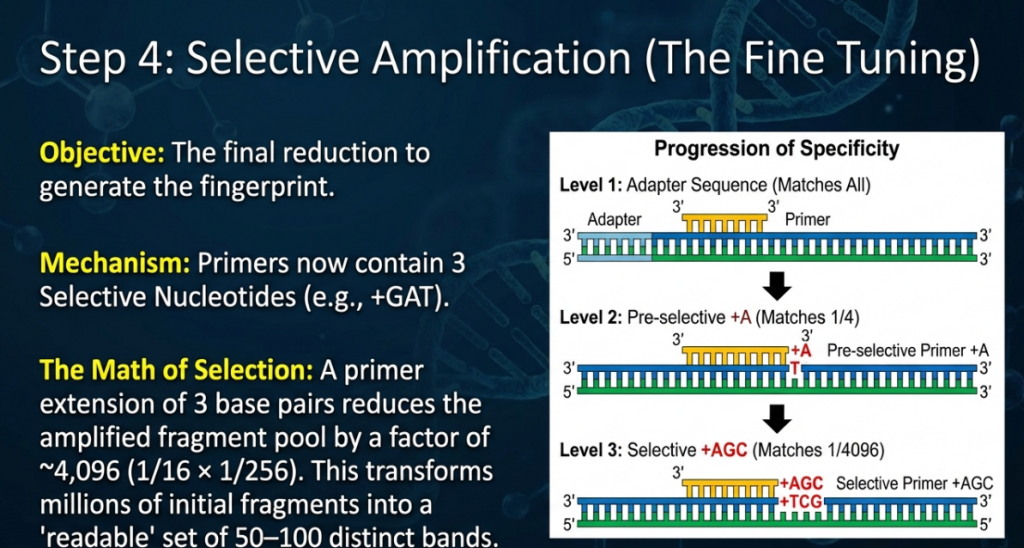
Step 4: Selective PCR Amplification
Primers with 2–3 selective nucleotides are employed. Only fragments matching all selective positions are amplified.
• Genome Scaling: For complex genomes, 3-bp selective extensions are standard, reducing the fragment population by a factor of 4,096 relative to the original digest. This prevents smearing and ensures a legible multiplex ratio.
Step 5: Separation and Visualization
Fragments (80–500 bp) are separated via polyacrylamide gel or capillary sequencing.

Separation: PAGE vs. Capillary Sequencing
As a Director, the choice of separation depends on throughput requirements. Manual Polyacrylamide Gel Electrophoresis (PAGE) provides single-nucleotide resolution but is labor-intensive. Automated Capillary Sequencers (registering signals in electropherograms) eliminate manual scoring errors and significantly increase data throughput, though they require higher capital investment.

Scoring Logic: Presence and Absence
AFLP markers are scored as a binary system (1 for presence, 0 for absence). The protocol operates on the Assumption of Homology: bands of identical molecular weight across different individuals are assumed to be identical in sequence.
| Observation | Binary Score | Biological Interpretation |
|---|---|---|
| Band Present | 1 | The individual possesses both the EcoRI and MseI restriction sites and the specific selective internal sequence at that exact distance. |
| No Band | 0 | The fragment is absent, indicating a point mutation at the restriction site or a structural rearrangement (insertion/deletion). |

Bioinformatic Interpretation
Binary data must be processed via similarity matrices to interpret genetic relatedness:
1. Jaccard’s Similarity Coefficients: Calculates genetic variation between accessions.
2. UPGMA Clustering: This hierarchical method is used to construct dendrograms. In my experience, these clusters often identify species related by cultivation history rather than just geography.
3. Principle Coordinate Analysis (PCA): A multivariate approach to visualize genetic clusters and validate the groupings found in UPGMA.
4. Software Implementation: Actionable analysis requires specific tools; we recommend NTSYSpc for similarity matrices and FAMD1.31 for principal coordinate computations.
• Strategic Visualization: Complexity is further managed by labeling only the EcoRI-directed primer (fluorescently or radioactively). To ensure a manageable fingerprint of 50–100 bands for manual scoring (though total fingerprints may reach 100–300), the rare-cutter primer (e.g., EcoRI) is radioactively or fluorescently labeled. MseI-MseI fragments are excluded from visualization because only the rare-cutter primer is labeled, effectively focusing the “screen” on the most informative genomic subset.
3. Comparative Evaluation: AFLP vs. Other Molecular Markers

AFLP remains competitive because it balances the reproducibility of RFLP with the convenience of RAPD, without the sequence-dependency of SSRs.
• Reproducibility: Operating under high-stringency PCR conditions, AFLP yields an experimental error rate of less than 2%, far superior to RAPD.
• Informativeness (Multiplex Ratio): A single reaction can amplify 50–100 polymorphic fragments, providing a massive data density per assay.
• Genome Coverage: Markers are distributed throughout the entire genome, including non-coding regions, ensuring comprehensive coverage.
• Dominant Marker Status: The primary drawback is that AFLP is a dominant marker system. It cannot distinguish between a homozygote and a heterozygote at a specific locus, as it only scores the presence or absence of a band.

4. Advanced Applications: From Microbial Typing to Betel Vine Diversity
AFLP’s ability to detect minor variations is indispensable in systematics, forensics, and pathotyping.
Case Study: Genetic Diversity in Betel Vine (Piper betle L.) In India, the betel vine is an economically vital cash crop, but its landraces are often misidentified due to regional naming conventions.

• Metrics: Using five primer combinations, researchers produced 323 total bands, identifying 155 polymorphic bands (47.99% polymorphism) with an average Polymorphic Information Content (PIC) of 0.14.
• Strategic Correction: Jaccard’s similarity coefficients (0.39–0.81) proved that genetic relatedness did not always correlate with geography. For instance, the ‘Kuljedu’ cultivar was genetically distinct from others in its region.

• The Dioecious Breakthrough: Because P. betle is dioecious (separate male and female plants) and propagated vegetatively, sex cannot be determined until maturity. AFLP polymorphic bands are currently being converted into Sequence Characterized Amplified Region (SCAR) markers. This allows for simple PCR-based sex identification at the seedling stage, a massive commercial advantage for breeders and cultivators.

5. Data Interpretation and Bioinformatic Analysis

The transition from physical banding patterns to phylogenetic models requires the conversion of gel images into a binary digital signature (1 for presence, 0 for absence).
Statistical Frameworks and Software To translate binary data into genetic relationships, specialized software and coefficients are required:
• Jaccard’s Similarity Coefficient: The industry standard for measuring genetic variation between cultivars.
• UPGMA & Cluster Analysis: Used to construct dendrograms that visualize evolutionary or variety-based clades.
• Principal Coordinate Analysis (PCA): Provides a multi-dimensional graphical representation of genetic relatedness.
• Specialized Software: Genomic specialists utilize NTSYSpc (Numerical Taxonomy and Multivariate Analysis System) and FAMD for these computations, ensuring the standardized measurement of fragment lengths and similarity indices.
6. Conclusion and Future Directions

AFLP remains a “gold standard” for DNA fingerprinting in an era of rapid genomic change. Its ability to generate thousands of markers without prior sequence data makes it uniquely suited for diversity studies across all domains of life. As technology advances, the conversion of dominant AFLP markers into locus-specific SCAR markers represents the future of the field, enabling cost-effective, targeted assays for traits like sex determination in dioecious species and marker-assisted selection in agriculture.

Image Summary


Questions/Answers
1. How does AFLP compare to other DNA markers like RAPD and RFLP?
Amplified fragment length polymorphism (AFLP) is considered a superior DNA marker system because it combines the reliability of restriction fragment length polymorphism (RFLP) with the power and utility of random amplified polymorphic DNA (RAPD). It is more time-efficient, generates significantly more information per reaction, and is more reproducible than many other marker systems.
Comparison to RAPD
• Reproducibility: A major drawback of RAPD is its low reproducibility because it uses short, arbitrary primers and low annealing temperatures. In contrast, AFLP is highly reproducible because it utilizes stringent PCR annealing conditions and specific adapters.
• Marker Density: While a single RAPD reaction typically produces only 5 to 10 bands, a single AFLP primer combination can generate between 50 and 100 markers simultaneously.
• Efficiency: AFLP is far more efficient for screening; for example, one study found that AFLP generated three times the number of data points compared to RAPD over an equivalent period.
• Sensitivity: Unlike RAPD, which is sensitive to template DNA concentration and purity, AFLP is relatively insensitive to DNA concentration because the reaction is optimized to cease when the labeled primer is consumed.
Comparison to RFLP
• DNA Quantity: One of the most significant differences is the amount of starting material required; RFLP analysis is labor-intensive and requires large quantities of DNA (up to 10 μg), whereas AFLP can be performed with as little as 0.05 to 0.5 μg.
• Detection Method: Traditional RFLP relies on Southern blotting and radioactive hybridization probes, which is time-consuming. AFLP uses PCR amplification for detection, allowing for a much faster and more automated workflow.
• Polymorphism Detection: RFLP only scans for differences within the restriction site itself, while AFLP uses selective nucleotides to detect polymorphisms both within and adjacent to the restriction site, allowing it to identify more point mutations than RFLP.
• Sequence Knowledge: While RFLP often requires prior sequence data or the physical cloning of DNA probes, AFLP requires no prior knowledge of the target genome sequence.
Summary of Strengths and Weaknesses
• Dominance: Like RAPD, AFLP typically generates dominant markers, meaning it generally cannot distinguish between homozygous and heterozygous individuals without proprietary technology or specific intensity analysis. RFLP is often co-dominant.
• Complexity and Cost: AFLP is more technically demanding and can be expensive if automated sequencing systems are used. However, the cost per polymorphic marker is often lower than other methods because of the high volume of data generated per reaction.
• Application: Because it does not require sequence information and provides genome-wide coverage, AFLP is frequently used to replace RFLP and RAPD in diversity studies, genetic mapping, and the differentiation of closely related organisms.
2. Explain the major steps involved in the AFLP laboratory procedure.
The Amplified Fragment Length Polymorphism (AFLP) technique is a highly reproducible, multi-locus DNA fingerprinting tool that combines restriction enzyme digestion with the utility of polymerase chain reaction (PCR). While some authors summarize the procedure in three stages (restriction/ligation, selective amplification, and analysis), others break it down into five major laboratory steps.
1. Digestion of Genomic DNA
The procedure begins with the isolation and purification of high-quality genomic DNA. This DNA is then double-digested simultaneously using two different restriction endonucleases. Typically, these include:
• A rare cutter: An enzyme with a six- to eight-base pair recognition sequence (e.g., EcoRI, PstI, or HindIII) that cuts the DNA less frequently, producing larger fragments.
• A frequent cutter: An enzyme with a four-base pair recognition sequence (e.g., MseI or TaqI) that cuts DNA frequently to generate small fragments (100–1,000 bp) ideal for PCR amplification and gel separation.
This digestion produces three types of fragments: those cut by the rare cutter on both ends, those cut by the frequent cutter on both ends, and those cut by one of each (rare/frequent).
2. Ligation of Adapters
Following digestion, double-stranded synthetic oligonucleotide adapters are ligated to the sticky ends of the DNA fragments. These adapters serve two critical functions:
• Creating primer binding sites: They provide a known sequence for universal PCR primers, eliminating the need for prior knowledge of the target genome’s sequence.
• Abolishing restriction sites: The adapters are designed such that the original restriction site is not restored upon ligation, preventing the restriction enzymes from re-cutting the fragments.
3. Pre-selective Amplification
Because restriction-ligation can generate thousands of fragments, the mixture is often too complex to resolve on a gel. Pre-selective PCR is performed to reduce this complexity. Researchers use primers complementary to the adapter and restriction site sequences, but with one additional selective nucleotide at the 3′ end. This step amplifies only a subset of the fragments (theoretically reducing the pool by a factor of 4 for each primer used), which helps decrease background smears in the final fingerprint.
4. Selective Amplification
A second round of PCR is conducted using the diluted pre-selective products as templates. In this stage, selective primers are used that contain two to three additional selective nucleotides at their 3′ ends. This further reduces the number of amplified fragments to a manageable range, typically 50–100 distinct bands.
To enable visualization of the final amplicons, one of the primers (usually the rare-cutter primer) is labeled radioactively (e.g., with 32P or 33P) or with a fluorescent dye. Fluorescent labeling allows for high-throughput analysis and the use of multiplexing.
5. Separation and Visualization
The amplified fragments are denatured and separated based on their molecular weight. This is achieved through:
• High-resolution denaturing polyacrylamide gel electrophoresis (PAGE): Labeled fragments migrate through the gel; smaller fragments move faster than larger ones.
• Detection: Radioactive fragments are visualized via autoradiography. Fluorescently labeled fragments are detected using automated capillary sequencers or laser scanners, which register signals as electropherograms analyzed by computer software.
6. Scoring and Analysis
Finally, the resulting banding patterns are analyzed to create a genomic fingerprint. AFLP markers are generally scored as dominant markers, where the presence of a band is scored as “1” and its absence as “0”. These binary data matrices are then used to calculate similarity coefficients and construct dendrograms or phylogenetic trees to interpret genetic relatedness.
3. What are the primary applications of AFLP in plant breeding and research?
Amplified fragment length polymorphism (AFLP) is a highly versatile tool in plant research, primarily used for genetic mapping, DNA fingerprinting, and assessing genetic diversity. In plant breeding, its reliability and high resolution make it a preferred technique for identifying varieties, cultivars, and landraces, as it can reveal minor genetic differences that are often indistinguishable through phenotypic or morphological features.
The primary applications of AFLP in plant breeding and research include:
• Genetic Mapping and Gene Tagging: AFLP is extensively used to construct high-density linkage and physical maps. It is particularly effective for mapping quantitative trait loci (QTLs) and tagging loci linked to important economic traits, such as disease and insect resistance, semidwarfism, and seedling vigor. These maps facilitate the positional cloning of genes of interest by helping researchers “land” on specific chromosomal segments.
• Marker-Assisted Breeding: The technique enhances the speed and efficiency of breeding through marker-assisted selection (MAS). In backcross breeding, AFLP markers help select offspring with the lowest percentage of donor-specific alleles, potentially reducing the number of generations needed to recover the elite parental genome. It is also used to identify sex-specific markers in dioecious plants, which can then be converted into simpler markers for gender determination.
• Germplasm Management and Diversity Studies: AFLP is an invaluable tool for assessing genetic variation within and between populations. This information is essential for germplasm management, allowing researchers to rationalize landrace collections, identify redundancies, and predict the agronomic performance of F1 hybrids based on their genetic distance.
• Variety Identification and Pedigree Analysis: Because it produces highly specific “genomic fingerprints,” AFLP is used for identity and parentage studies, and to ensure the purity of hybrid seed production by identifying contaminating varieties.
• Transcriptomics and Epigenetics: Beyond DNA sequence analysis, modified AFLP protocols are used for specialized research. cDNA-AFLP allows for comprehensive transcript profiling to compare gene expression across different phenotypes or developmental stages, such as potato tuberization. Methylation-sensitive amplified polymorphism (MSAP) is used to study DNA methylation patterns, helping researchers understand epigenetic regulation in plants.
• Conservation and Systematics: AFLP assists in phylogenetic and taxonomic studies, helping to define genetically distinct units for the protection of endangered species and establishing biogeographic patterns.
4. How does AFLP distinguish between homozygous and heterozygous individuals?
Standard AFLP analysis typically cannot distinguish between homozygous and heterozygous individuals because the system generates dominant markers,,. In standard scoring, both genotypes produce a visible band at the same locus, meaning the presence of a band is scored as “1” and its absence as “0” regardless of the number of allele doses,,,.
However, distinction is theoretically possible through the following methods:
• Intensity Polymorphism Analysis: Researchers can distinguish between the two by measuring band intensity, under the rationale that homozygotes should produce twice the amount of PCR product compared to heterozygotes,.
• Specialized Software and Equipment: This quantitative approach requires proprietary technology or specialized software (such as AFLP-Quantar Pro) and high-resolution detection systems like automated capillary sequencers or phosphorimagers,,,.
• Codominant Fragment Lengths: In rare instances, AFLP markers can behave as codominant markers if natural insertions, deletions, or microsatellite variations cause the true alternative alleles at a single locus to have different fragment lengths,. These are observed at low frequencies in specific contexts, such as segregating F2 populations,.
Despite these possibilities, scoring AFLP markers as codominant is often discouraged or viewed with caution,. The non-linear nature of PCR at high cycle numbers and potential experimental errors make it difficult to reliably assign zygosity based on signal intensity, especially in random-mating populations,. Under standard laboratory conditions without specialized analytical tools, AFLP amplicons continue to be treated as separate, independent loci rather than different alleles of the same locus.
5. Does the technical complexity of AFLP limit its accessibility?
Yes, the technical complexity of AFLP can limit its accessibility, as it is more labor-intensive and technically demanding than other marker systems like RAPD. The process involves multiple stages—including restriction, ligation, and two separate rounds of PCR amplification—which typically take at least eight hours to complete.
Several specific factors contribute to these limitations:
• DNA Quality Requirements: AFLP requires high-quality, purified, and high-molecular-weight genomic DNA to ensure complete digestion by restriction enzymes. Contaminants or degraded DNA can lead to partial digestion, which produces non-comparable profiles and false polymorphisms.
• Equipment and Specialized Resources: For optimal resolution and high-throughput analysis, the technique requires expensive automated DNA sequencers or capillary electrophoresis systems. Furthermore, the resulting fingerprints are highly complex, often producing 50 to 100 bands per reaction, which necessitates dedicated fingerprinting analysis software for accurate scoring and interpretation.
• Cost: While the cost per polymorphic marker is relatively low due to high data output, the initial cost of automated systems and commercial kits can be a barrier for some laboratories.
Despite these technical hurdles, AFLP offers unique advantages that actually enhance its accessibility in specific research contexts:
• No Prior Sequence Knowledge: Unlike microsatellites or RFLP, AFLP does not require prior knowledge of the target genome’s sequence, making it a “ready to use” technology for any species.
• Commercial Standardization: The availability of commercial AFLP kits (e.g., from Applied Biosystems or Invitrogen) has standardized the methodology, making it more accessible and requiring less user input for laboratories with access to the necessary hardware.
• Universal Applicability: Because it utilizes universal adapters and primers, a single protocol can be applied to a wide variety of organisms, from bacteria to complex plants.
In summary, while the laboratory procedure and data analysis are complex, the ability to rapidly screen thousands of loci in any organism without prior genomic information often makes AFLP more accessible and efficient than developing species-specific markers.
6. How do selective nucleotides reduce the number of amplified fragments?
Selective nucleotides reduce the number of amplified fragments by restricting primer binding to only a specific subset of genomic restriction fragments that contain a perfect match to the added bases. These nucleotides are added to the 3′ ends of AFLP primers and extend into the unknown genomic sequence flanking the restriction site.
The mechanism and impact of selective nucleotides include the following:
1. Mathematical Reduction of Fragment Complexity
Because there are four possible DNA bases (A, C, G, and T), each selective nucleotide added to a primer reduces the number of fragments that can be amplified by a factor of four, assuming a random distribution of nucleotides in the genome. When selective nucleotides are added to both the rare-cutter (e.g., EcoRI) and frequent-cutter (e.g., MseI) primers, the reduction effect is multiplicative:
• One selective nucleotide on both primers (+1/+1): Reduces the population of fragments by a factor of 16 (1/4 × 1/4).
• Two selective nucleotides on both primers (+2/+2): Reduces the pool by a factor of 256 (1/16 × 1/16).
• Three selective nucleotides on both primers (+3/+3): Reduces the pool by a factor of 4,096 (1/64 × 1/64).
2. High Stringency Requirements
AFLP-PCR is performed under highly stringent annealing conditions to ensure that only fragments with a perfect match to the selective nucleotides are elongated. If a single-nucleotide polymorphism (SNP) occurs at the position adjacent to the restriction site, it creates a mismatch at the 3′ end of the primer, preventing amplification of that specific fragment.
3. Tuning Based on Genome Size
The number of selective nucleotides is typically “tuned” to the complexity and size of the target genome to produce a manageable fingerprint of 50 to 100 distinct bands.
• Small Genomes (10⁶–10⁷ bp): Primers usually contain one to two selective nucleotides.
• Large/Complex Genomes (10⁸–10⁹ bp): Primers generally require three selective nucleotides to prevent background smears caused by too many overlapping bands.
4. Limits of Selectivity
While adding nucleotides increases selectivity, this effect generally peaks at three bases. Researchers have observed that adding a fourth selective nucleotide can lead to a loss of selectivity because the PCR process begins to tolerate mismatches, resulting in the amplification of extra bands that were not present when using three-base extensions.
5. Multi-Step Reduction
In practice, this reduction often occurs in two stages to maximize quality:
• Pre-selective Amplification: Uses primers with one selective nucleotide to reduce the thousands of initial restriction fragments to a more manageable subset.
• Selective Amplification: Uses the pre-selective products as a template for a second PCR with primers containing two to three selective nucleotides, further refining the mixture to the final desired number of bands.
7. Can AFLP detect codominant markers through sequence variations?
Standard AFLP analysis is primarily characterized as a dominant marker system, meaning it typically cannot distinguish between homozygous and heterozygous individuals through simple presence-absence scoring,,. However, the technique can detect codominant markers in specific circumstances, either through natural sequence variations that alter fragment length or through the quantitative analysis of band intensity,,.
Detection Through Sequence Variations
True codominance in AFLP occurs when alternative alleles at a single locus possess different fragment lengths, rather than one allele failing to amplify. These length differences can arise from:
• Internal sequence length changes: Natural insertions or deletions (indels) within the DNA fragment between the two restriction sites.
• Microsatellite variations: Natural microsatellite repeat variations among different genotypes.
In these instances, both alleles are amplified but appear at different positions on the gel. While these codominant markers are highly informative for genetic mapping and tracking inheritance, they are generally observed at low frequencies in segregating populations.
Detection Through Intensity Polymorphism
Because homozygous individuals carry two copies of an allele and heterozygotes carry only one, homozygotes theoretically produce twice the amount of PCR product,. This difference in “allele dosage” can be used to score markers codominantly,. This approach requires:
• Quantitative Detection: The use of automated capillary sequencers, phosphorimagers, or laser scanners that can register signal intensities,,.
• Specialized Software: Dedicated software, such as AFLP-Quantar Pro or CrossChecker, is necessary to analyze density levels and differentiate between half-intense and full-intense bands,,.
Limitations and Challenges
Despite these technical possibilities, treating AFLP as a codominant system is often viewed with caution for several reasons:
• PCR Non-linearity: The non-linear nature of PCR at high cycle numbers can make it difficult to reliably equate band intensity with allele dosage,.
• Scoring Errors: Without molecular evidence of which bands are alternative alleles of the same locus, researchers typically treat each band as a separate, independent locus. This practice can inflate the number of loci under study and lead to an overestimation of genetic variation,.
• Population Type: Scoring intensity is particularly difficult and discouraged when working with random-mating populations, as opposed to strictly controlled mating systems or pedigrees where inheritance patterns are predictable,.
8. Can AFLP detect DNA methylation changes in plant tissues?
Yes, AFLP can detect DNA methylation changes through a specialized modification of the standard protocol known as Methylation-Sensitive Amplified Polymorphism (MSAP). This derived technique targets variation in the distribution of DNA methylation—chemical modifications of DNA bases, primarily cytosines—which can differ dramatically between individuals or cell types.
The MSAP procedure works through the following mechanisms:
• Use of Isoschizomers: The technique utilizes isoschizomers, which are pairs of restriction enzymes (such as MspI and HpaII) that recognize the same DNA sequence (typically 5′-CCGG) but possess different sensitivities to DNA methylation.
• Parallel Reactions: The protocol is applied to genomic DNA by running parallel restriction reactions using the isoschizomers as frequent cutters in combination with a common rare cutter, such as EcoRI.
• Differential Recognition: In these reactions, MspI only recognizes MeCpG sites, whereas the enzyme HpaII recognizes plant-specific hemiMeCpCpG sites. Sites that are hypermethylated or fully methylated at the external cytosines on both strands are not cut by either enzyme, while sites free of methylation are recognized and cut by both.
• Banding Pattern Analysis: A difference in the resulting banding patterns between the parallel reactions serves as an indicator of methylation variation at specific restriction sites.
These methylation signals are essential for regulating plant development by influencing gene transcription. MSAP is particularly valuable for studying biological processes such as epigenetic gene silencing, mobile element control, and gene activation. While many of the polymorphic fragments identified through MSAP consist of non-coding regions, a fraction of this variation is expected to correspond directly to epigenetic silencing or activation of genes.
9. How is AFLP used to identify sex-specific markers in animals?
AFLP is used to identify sex-specific markers in animals by comparing the DNA fingerprints generated from individuals of known male and female genders,. This technique is applicable to any organism with genetic sex determination and is particularly valuable for species where sex chromosomes have diverged so little that few other markers are available,.
Core Mechanism for Identification
When male and female AFLP products are compared, the technique amplifies three distinct categories of markers:
• Monomorphic markers: These are common to all samples regardless of sex.
• Polymorphic markers: these vary between individuals irrespective of their gender.
• Sex-specific markers: These are confined to the heterogametic sex (the gender with two different sex chromosomes, such as XY males or ZW females) and represent Y-specific or W-specific DNA,.
Examples in Animal Research
• Birds: AFLP successfully isolated three W-chromosome-linked markers in the ostrich (Struthio camelus) and two in the shag (Phalacrocorax aristotelis),. The shag was a particularly notable case because it had resisted sex identification using other ubiquitous avian DNA tests.
• Fish: The technique has been used to identify sex-linked markers in rainbow trout (Oncorhynchus mykiss).
• Crustaceans: Researchers have utilized AFLP to develop sex-specific linkage maps for white shrimp (Penaeus vannamei).
Refinement and Practical Application
Once a sex-specific AFLP marker is identified, it can be used to identify gender directly, but researchers often choose to excise the band from the gel and sequence it,. This sequence data is then used to design primers for a standard PCR-based sexing test, which is often less technically demanding and more cost-effective for processing large numbers of samples,,. Designing a specific PCR test also helps mitigate the risk of “null alleles,” where a Y or W chromosome is present but the marker fails to amplify due to minor mutations,.
Advantages Over Other Methods
AFLP is considered superior to methods like Random Amplified Polymorphic DNA (RAPD) for isolating sex markers because it is significantly more powerful, typically producing 50 to 100 bands per reaction compared to the 5 to 10 bands produced by RAPD. This high marker density increases the probability of finding a band linked to a sex chromosome. Furthermore, AFLP is highly reproducible and stable, remaining consistent even when there is a 1,000-fold difference in the quantity of template DNA.
10. How can AFLP analysis reveal the geographic origins of specific plant genotypes?
AFLP analysis reveals the geographic origins of specific plant genotypes by generating high-density genomic fingerprints that reflect the genetic relatedness and evolutionary history of different populations. By comparing these fingerprints, researchers can identify distinct markers that are unique to or prevalent in specific regions, allowing them to trace the movement and provenance of plant materials.
The specific mechanisms through which AFLP analysis exposes geographic origins include:
1. Detection of Region-Specific Polymorphisms
AFLP is highly sensitive to minor genetic variations, such as point mutations, insertions, and deletions, that accumulate in isolated populations over time. Because AFLP markers are distributed throughout the entire genome, they can capture regional genetic signals resulting from founder effects, geographical isolation, and restricted gene flow. These variations serve as diagnostic tools to define genetically distinct units associated with specific locations.
2. Hierarchical Clustering and Dendrograms
Researchers use binary data (the presence or absence of bands) to calculate similarity matrices using coefficients such as Jaccard’s. These matrices are then analyzed using methods like the unweighted pair group method with arithmetic averages (UPGMA) to construct dendrograms.
• Grouping by Proximity: In many species, individuals from the same population or geographic region group together in the same clades, indicating a closer genetic relationship than with individuals from distant sites.
• Traceability: For example, in a study of tea (Camellia sinensis), genotypes from India and Kenya clustered according to their known geographical origins, providing evidence for the common ancestry of Kenyan clones with Indian populations.
3. Tracing Introduction Routes
AFLP is an effective tool for identifying the original sources of introduced germplasm. By comparing the fingerprints of natural (indigenous) populations with those of introduced populations, researchers can infer historical movements.
• Moringa Study: Genetic analysis of Annual Drumstick (Moringa oleifera) suggested at least two distinct sources of germplasm introduction to Kenya from India.
• Lentil Origins: AFLP analysis provided strong support for designating specific subspecies (spp. orientalis) as the progenitor of cultivated lentils, helping to establish biogeographic evolutionary patterns.
4. Quantifying Inter-Population Variation
Through Analysis of Molecular Variance (AMOVA), AFLP can partition genetic variability into components that exist within and between populations. Significant differences detected between regions—even in outcrossing perennial plants where high variation is expected within a single population—highlight the role of geographical isolation in shaping the genetic structure of a species.
Limitations and Nuances
While AFLP is a robust tool for revealing geographic patterns, its results must be interpreted with caution in certain contexts:
• Vegetative Propagation: In plants like betel vine (Piper betle L.), cultivars may be grouped by genetic relatedness rather than their collection site because elite materials are frequently shared across breeding stations and maintained through vegetative propagation.
• Naming Inconsistencies: Geographic identification can be complicated by “etymology” issues, where a single landrace may have different names in different regions, or different landraces may share the same name.
• Neutral Markers: AFLP generally utilizes neutral markers, meaning it reflects the history of the population rather than adaptive processes, unless specific markers are closely linked to selective traits.
11. Can AFLP identify mutations that occur specifically within the restriction sites?
Yes, AFLP can identify mutations that occur specifically within restriction sites. The technique is designed to detect DNA polymorphisms caused by single-nucleotide polymorphisms (SNPs) or insertions/deletions (INDELs) that either create or abolish these recognition sites.
The impact of mutations within these sites is observed in the following ways:
• Abolishing a Site: A base substitution within a restriction enzyme recognition site causes the loss of that restriction site, which leads to the loss of the corresponding restriction fragment. Because AFLP analysis is typically scored based on the presence or absence of bands, the loss of a site results in the disappearance of a specific band from the genomic fingerprint.
• Creating a Site: Conversely, a single base change in a previously non-matching sequence can generate a new cutting site for the restriction enzyme. This results in the production of additional restriction fragments and the appearance of new bands in the AFLP profile.
• Detection Sensitivity: Because AFLP utilizes two different restriction enzymes (a rare cutter and a frequent cutter), it can scan for mutations across hundreds of thousands of sites simultaneously. It is considered highly sensitive because a mutation in even a single base of the recognition sequence is sufficient to prevent the enzyme from cutting, thereby altering the resulting DNA pattern.
While AFLP is highly effective at identifying mutations within the restriction sites, it also detects mutations in the sequences immediately adjacent to these sites through the use of selective nucleotides on the PCR primers. If a mutation occurs in the first few bases flanking the restriction site and does not match the selective extension of the primer, amplification will be prevented, also resulting in a presence-absence polymorphism.
12. Can MSAP identify environmental impacts on a plant’s epigenetic profile?
Methylation-Sensitive Amplified Polymorphism (MSAP) is a specialized AFLP-derived technique specifically designed for epigenetic studies,. It is used to identify variations in the distribution of DNA methylation, primarily chemical modifications of cytosine bases, which play a critical role in regulating plant development, gene transcription, and mobile element control.
While standard DNA markers are generally not subject to environmental influences, DNA methylation signals can differ dramatically between individuals or even between different cell types within a single individual,. MSAP identifies these epigenetic variations through the following mechanisms:
• Differential Enzyme Sensitivity: The technique utilizes isoschizomers, which are pairs of restriction enzymes (such as MspI and HpaII) that recognize the same DNA sequence but possess different sensitivities to DNA methylation.
• Parallel Reaction Analysis: By running parallel restriction reactions, researchers can identify differences in banding patterns that serve as indicators of methylation variation at specific sites.
• Detection of Silencing and Activation: A fraction of the variation detected by MSAP corresponds directly to epigenetic gene silencing or activation. This allows researchers to monitor how a plant’s epigenetic profile responds to biological processes and potentially to the impacts of environmental stressors.
Because MSAP can detect these relatively stable but reversible chemical modifications, it is an invaluable tool for understanding epigenetic regulation and how it produces differences between phenotypes that DNA sequence markers alone might not reveal.
13. How do selective primers ensure that only a specific subset of DNA fragments is amplified?
Selective primers ensure that only a specific subset of DNA fragments is amplified by utilizing 3′ extensions that match only a fraction of the available genomic sequences. These primers are composed of a 5′ core sequence complementary to the ligated adapter, a sequence matching the restriction enzyme site, and a selective extension of one to three nucleotides at the 3′ end. The selective nucleotides extend beyond the restriction site and into the unknown flanking sequence of the DNA fragment.
Because there are four possible DNA bases (A, C, G, or T) at any given position, a primer with one selective nucleotide will only bind to—and thus only amplify—approximately one-fourth of the restriction fragments. When selective nucleotides are used on both the rare-cutter and frequent-cutter primers, the reduction in complexity is multiplicative; for instance, primers with three selective nucleotides on both ends reduce the amplified pool by a factor of 4,096 (calculated as 1/64×1/64).
To maintain this precision, the PCR is conducted under highly stringent annealing conditions to ensure that only fragments with a perfect match to the 3′ extensions are primed and elongated. If a single-nucleotide mismatch occurs at these terminal bases, the DNA polymerase cannot initiate extension, effectively excluding that specific fragment from the final genomic fingerprint. While adding nucleotides increases selectivity, researchers generally limit the extension to three bases, as adding a fourth nucleotide can lead to a loss of selectivity by allowing the reaction to tolerate mismatches and produce inconsistent bands.
14. Are there specific genomes where AFLP is more effective than others?
AFLP is a universal DNA fingerprinting tool effective for investigating genomes of any origin or complexity, ranging from small bacterial genomes to large, complex plant genomes. While applicable to any species, its effectiveness is optimized by tailoring the procedure to specific genomic characteristics.
Effectiveness Based on Genome Size and Complexity
• Small Genomes: AFLP is highly efficient for small genomes, such as those of bacteria and fungi, because manageable fingerprints can be generated using primers with only one or two selective nucleotides.
• Large and Complex Genomes: For larger genomes (typically 108 to 109 bp) like those found in higher plants, AFLP remains effective by using three selective nucleotides to mathematically reduce the complexity of the amplified fragment pool to a resolvable 50–100 bands.
• Model Species: AFLP is considered particularly promising for mapping in species like rice, which has a relatively small genome and a high percentage of single-copy DNA sequences.
• Limitations in Highly Repetitive Genomes: In the complex genomes of some higher plants, the typical linear correlation between genome size and the number of amplified fragments is lost due to high numbers of repeated sequences, resulting in fingerprints dominated by multicopy restriction fragments.
Effectiveness Based on Base Composition (AT/GC Content)
The choice of restriction enzymes significantly impacts the technique’s accuracy based on the genome’s nucleotide distribution:
• AT-Rich Genomes: Because the DNA of most eukaryotes is AT-rich, the enzyme MseI (which recognizes the sequence TTAA) is the preferred frequent-cutter. It is specifically cited as a suitable choice for the malaria parasite Plasmodium falciparum, which has an 80% AT content.
• GC-Rich Genomes: For organisms with GC-rich DNA, such as certain bacteria like Xanthomonas or Aeromonas, researchers often find that standard enzymes like EcoRI and MseI produce unevenly distributed banding patterns. In these cases, a combination of enzymes like PstI and TaqI is more effective.
Effectiveness in Specific Genetic Contexts
• Genetically Uniform or Monomorphic Species: AFLP is highly effective for typing genetically monomorphic bacterial species (such as Bacillus anthracis) because its multi-locus nature allows it to inspect a large percentage of the genome to detect rare molecular variations.
• Closely Related Populations: The technique is exceptionally powerful for identifying genetic variation in closely related species, varieties, or cultivars that may not be distinguishable using other markers.
• Unsequenced Genomes: AFLP is most effective as a “ready to use” technology for taxa where much is still unknown about the genomic makeup, as it requires no prior sequence information or probes.
15. What are the risks of ‘null alleles’ in animal sexing studies?
In animal sexing studies, ‘null alleles’ represent the primary threat to the accuracy of gender identification. A null allele occurs in a situation where the sex-specific chromosome (the Y or W) is present, but the targeted genetic marker fails to amplify.
The risks and mitigation strategies associated with null alleles include:
• Misidentification of Gender: Because AFLP is a dominant marker system, gender is typically determined by the presence (heterogametic sex) or absence (homogametic sex) of a band. If a heterogametic individual carries a null allele, they will be incorrectly scored as the homogametic sex because the diagnostic band is missing.
• Statistical Challenges: To achieve small, acceptable confidence limits on the occurrence of null alleles, researchers require large sample sizes of known-sex individuals. for instance, testing 100 heterogametic individuals is necessary to achieve a confidence limit of 0.4%.
• Geographic Variation: The risk of null alleles can be more effectively assessed by testing individuals from a wide geographical range rather than a single population, as genetic variation that leads to non-amplification may be region-specific.
• Mitigation via PCR Conversion: The a priori expectation of null alleles can be significantly reduced by converting an identified AFLP marker into a specific PCR test. In a multiplex PCR test used at moderate stringency, only mutations occurring at the specific 3′ primer ends (approximately 6 bp) are likely to stop amplification, making the test more robust and accurate for processing large numbers of samples.
To ensure accuracy when using AFLP directly for sexing, researchers often use a reference band as a positive control. This reference band, which should be less intense than the Y-specific band, guarantees the gender is correctly scored even if the overall reaction intensity is reduced.
16. Why are AFLP markers useful for constructing high-density genetic maps?
AFLP markers are highly effective for constructing high-density genetic maps because of their extraordinary capacity to detect a large number of polymorphic loci simultaneously throughout the entire genome.
The primary reasons for their utility include:
• High Marker Abundance and Efficiency: A single AFLP primer combination can generate between 50 and 100 markers simultaneously, which is roughly 10-fold more than systems like RAPD. Because every primer combination is usable, researchers can rapidly screen thousands of independent genetic loci with minimal effort.
• Genome-Wide Coverage: AFLP markers are highly abundant and randomly distributed across the genome, including both nuclear and organellar DNA. This allows them to fill gaps in existing maps where other markers, such as RFLPs, may not have mapped any loci.
• Superior Resolution for Fine-Scale Mapping: The technique is highly sensitive to minor genetic variations, making it ideal for fine-scale mapping and saturating specific chromosomal segments with markers. This high density is critical for “chromosome landing” and providing the site-saturating clones required for positional gene cloning via chromosome walking or jumping.
• Mendelian Inheritance: AFLP markers typically segregate in a stable Mendelian fashion. This predictable inheritance allows them to be reliably used to track genetic loci in progeny from crossed lines and to calculate genetic distances for map construction.
• No Prior Sequence Knowledge Required: Because the system uses universal adapters and primers, it can be applied to any organism without prior knowledge of its genomic sequence. This makes it a “ready to use” tool for constructing maps in taxa where the genomic makeup is still largely unknown.
• Robustness and Reproducibility: Unlike other PCR-based methods like RAPD, AFLP utilizes highly stringent annealing conditions, which ensures high reproducibility and reliable data for inter-laboratory comparisons.
By generating more than double the number of genetic markers compared to traditional RFLP analysis, AFLP acts as an enabling technology that bridges the gap between genetic and physical maps.
17. How are AFLP markers converted into standard PCR tests?
The conversion of AFLP markers into standard PCR tests—often referred to as Sequence Characterized Amplified Region (SCAR) markers—is a common practice used to simplify the identification of specific genetic traits, such as sex-linked markers or disease resistance. This process transitions a complex multilocus fingerprint into a simple, reliable, and cost-effective single-locus test.
The conversion procedure involves the following major steps:
1. Isolation of the Marker
The first step is to identify and recover the specific polymorphic band of interest from the electrophoresis gel.
• Locating the Band: Researchers determine the exact location of the target fragment by comparing the dried polyacrylamide gel to its corresponding autoradiograph.
• Excision: The band is cut from the gel using a scalpel. Silver-stained gels are often preferred for this process because they allow for the direct excision of bands without the use of radioactive isotopes, offering high resolution for fragments greater than 300 bp.
• DNA Extraction: The DNA is removed from the gel slice using methods such as the “crush and soak” technique in TE buffer or by rehydrating the slice in distilled water and heating it at 95°C to dissolve the DNA.
2. Reamplification and Purification
Because the amount of DNA recovered from a single gel band is minimal, it must be reamplified via PCR. This reaction typically uses the same selective primers that were employed in the original AFLP reaction. Once reamplified, the DNA product is purified to remove residual reagents and contaminants.
3. Cloning and Sequencing
To design specific primers, the internal sequence of the AFLP fragment must be known.
• Cloning: The purified PCR product is cloned into a plasmid vector (such as pUC18 or pGEM-T) and transformed into competent E. coli cells.
• Sequencing: The cloned DNA template is then sequenced using automated DNA sequencers to determine the nucleotide order of the fragment.
4. Primer Design and Standardization
Once the sequence is obtained, the original AFLP primer and adapter sequences are removed from the data.
• Specific Primers: Researchers design new PCR primers (usually 20–24 bp long) that are perfectly complementary to the internal sequence of the cloned fragment.
• Multiplex PCR: These specific primers are often used in a multiplex PCR format alongside internal positive control primers.
Advantages of the Converted Test
Converting an AFLP marker into a standard PCR test significantly increases accuracy and robustness. Unlike standard AFLP, which can be sensitive to “null alleles” (where a marker fails to amplify due to minor mutations), a SCAR marker used at moderate stringency is less likely to be affected by sequence variation outside the specific 3′ primer binding sites. This makes the resulting test more suitable for processing large numbers of samples in clinical, forensic, or breeding applications.
18. How do researchers use positive controls to avoid misidentification?
Researchers use positive controls in AFLP analysis primarily to ensure that the absence of a specific DNA band is due to the genetic makeup of the sample rather than a failure in the laboratory procedure.
Reference Bands as Positive Controls
In studies such as animal sexing, where identification depends on the presence or absence of a single sex-specific band, researchers utilize reference bands as positive controls. These controls follow specific criteria:
• Intensity: The reference band should be less intense than the diagnostic (e.g., Y-specific) band.
• Verification: The presence of this control band guarantees that the reaction was successful. If the control band is visible but the diagnostic band is missing, the researcher can confidently score the individual as homogametic rather than a misidentified heterogametic individual whose reaction simply failed or had a short exposure time.
Internal Controls in PCR-Based Tests
When researchers convert AFLP markers into simpler, standard PCR tests for high-throughput analysis, they incorporate internal positive controls to enhance accuracy.
• Co-amplification: In avian research, for example, researchers often co-amplify a known conserved fragment, such as the CHD gene, alongside the identified sex-specific marker.
• Detecting Null Alleles: This internal control is vital for identifying “null alleles,” where a specific chromosome is present but its associated marker fails to amplify due to a mutation at the primer binding site.
Systematic Quality Controls
Beyond specific positive bands, researchers employ a broader set of controls to avoid misidentification:
• Negative Controls: These are used to test for systematic contamination; any DNA fragments appearing in a negative control indicate that the results of the entire batch may be compromised.
• Replicates: Researchers are encouraged to replicate approximately 20% of their samples to calculate error rates and verify the high reproducibility required for accurate genotyping.
• Internal Size Standards: In automated capillary systems, every lane includes an internal size standard (labeled with a distinct fluorescent dye) to ensure that all fragments are accurately sized and compared across different runs.
19. Could AFLP reveal the specific mutations responsible for crop disease resistance?
AFLP can reveal specific mutations responsible for crop disease resistance, but it is typically used as a tool to identify markers tightly linked to resistance genes rather than identifying the causal mutation directly. By detecting single-nucleotide polymorphisms (SNPs) and insertions/deletions (INDELs), AFLP provides the high-resolution data necessary for positional cloning and gene tagging.
Detection of Sequence-Level Mutations
AFLP is highly sensitive to minor genetic differences and can detect specific mutations through several mechanisms:
• Restriction Site Alterations: AFLP identifies SNPs or INDELs that either create or abolish restriction enzyme recognition sites. A base substitution within these sites leads to the loss or gain of a restriction fragment, altering the genomic fingerprint.
• Primer Binding Site Mutations: Because AFLP uses selective nucleotides at the 3′ end of primers, a mutation in the sequence immediately adjacent to a restriction site will cause a mismatch. This prevents the DNA polymerase from extending the primer, resulting in a presence-absence polymorphism.
• Internal Rearrangements: Mutations such as insertions or deletions occurring within the amplified fragment will cause shifts in fragment size, which are visible during electrophoresis.
Applications in Identifying Resistance Genes
While AFLP identifies variations across the entire genome, its primary power in disease research is in mapping quantitative trait loci (QTLs) and specific resistance genes:
• Positional Cloning: AFLP is used for “chromosome landing,” a strategy to isolate genes by identifying markers so closely linked to a resistance locus that no recombination events are detected.
• High-Density Mapping: Because it can screen thousands of independent loci simultaneously, AFLP is used to saturate specific chromosomal segments with markers, providing the “site-saturating clones” required for cloning genes by chromosome walking.
• Proven Resistance Mapping: Researchers have successfully used AFLP to identify markers for several critical resistance genes, including:
◦ The Cf−9 gene in tomato (resistance to leaf mould).
◦ The Gro1 locus in potato (resistance to root cyst nematodes).
◦ The R1 locus in potato (resistance to late blight).
◦ The Mer locus in poplar trees (resistance to leaf rust fungus).
Characterizing the Mutation
To reveal the exact molecular nature of a mutation identified by an AFLP marker, the specific DNA band must be excised from the gel, reamplified, and sequenced. This sequence data allows researchers to find strain-specific sequences and characterize the genetic determinants of a phenotype, such as virulence or resistance. Despite its power, it is important to note that most AFLP markers occur in non-coding regions of the genome; therefore, a linked marker is often a “neutral” indicator of a nearby resistance gene rather than the mutation within the gene itself.
20. Why is AFLP more effective for analyzing genomes with high repetitive sequences?
AFLP is highly effective for analyzing genomes with high repetitive sequences because it utilizes multicopy restriction fragments that appear as intense, identifiable markers within a genomic fingerprint. In the complex genomes of higher plants, the typical linear correlation between genome size and the number of amplified fragments is often lost due to these high numbers of repeated sequences. Fingerprints in such organisms consist predominantly of unique AFLP fragments but are distinguished by the presence of a small number of highly intense repeated fragments that serve as distinct genetic landmarks.
The effectiveness of AFLP in repetitive regions is further enhanced by the following factors:
• Detection of Highly Mutable Loci: AFLP effectively captures variations in microsatellite sequences (simple sequence repeats of 1–6 bp), which exhibit high mutation rates due to DNA polymerase slippage. This slippage leads to the expansion or contraction of the repeats, causing measurable changes in the length of the restriction fragments.
• Genome-Wide Coverage: Because AFLP is a multi-locus technique, it provides genome-wide coverage that includes both unique and repetitive regions. It can detect genetic variations resulting from the unequal crossing over of minisatellite and satellite sequences, which accounts for a significant portion of total genomic polymorphism.
• High Resolution and Multiplexing: A single primer combination can simultaneously analyze hundreds of independent loci, providing a robust power of differentiation that is often superior to using individual microsatellite markers alone. This high “multiplex ratio” allows researchers to screen a representative fraction of the genome to detect rare molecular variations even in genetically uniform or highly repetitive backgrounds.
• Bridging Genetic and Physical Maps: AFLP is considered an enabling technology for complex genomes because it can bridge the gap between genetic and physical maps by identifying 100,000s of unique fragments that act as landmarks across the repetitive landscape of the genome.
While other systems like microsatellites are useful for population genetics, AFLP is often more reliable and easier to use in complex genomes because it does not require prior sequence information to target these repetitive regions.
21. How can AFLP determine if two similar organisms are different species?
AFLP determines if two similar organisms are different species by generating high-resolution genomic fingerprints that reveal minor genetic differences often invisible to phenotypic or morphological analysis. By comparing the presence and absence of hundreds of DNA fragments simultaneously, researchers can quantify the level of genetic variation and define taxonomic boundaries.
The process of determining species status through AFLP involves several key mechanisms:
1. Calculation of Similarity Matrices
AFLP analysis produces binary data (scored as “1” for the presence of a band and “0” for its absence). This data is used to calculate similarity coefficients (such as Jaccard or Nei and Li) that represent the proportion of shared DNA fragments between individuals.
• Conserved common bands define the common roots and genetic relatedness between the samples.
• Polymorphic bands define the differentiation and branching points used to separate taxa.
2. Hierarchical Clustering and Dendrograms
Researchers use similarity matrices to perform cluster analysis, most commonly through the unweighted pair group method with arithmetic averages (UPGMA). The results are visualized as a dendrogram (a phylogenetic tree), where individuals belonging to the same species group together in monophyletic clades, while different species form distinct, separate branches.
3. Application of “Windows of Similarity”
In microbiology and systematics, species identification is often standardized by defining specific windows of similarity based on the percentage of shared bands:
• 90% to 100% similarity: Typically indicates individuals are the same strain or identical genotypes.
• 35% to 90% similarity: Generally indicates different strains of the same species.
• Less than 35–40% similarity: Typically suggests the organisms are different species within the same genus.
4. Detection of Fixed Diagnostic Markers
Because AFLP scans the entire genome, it can identify “fixed markers”—specific DNA fragments that are consistently present in one species but entirely absent in another. In reproductively isolated populations, these markers serve as diagnostic tools to distinguish between morphologically identical organisms.
5. Effectiveness with Unsequenced Genomes
A major advantage of AFLP is that it requires no prior knowledge of the target genome’s sequence. This makes it a “ready-to-use” technology for identifying new or poorly understood species, as it relies solely on naturally occurring DNA polymorphisms caused by point mutations, insertions, or deletions within or adjacent to restriction sites.
Examples of Species Differentiation
• Bacteria: AFLP has been shown to have a high correlation with the “gold standard” of DNA-DNA hybridization, successfully delineating genomic species in complex genera like Aeromonas and Acinetobacter.
• Plants: In the genus Camellia, AFLP successfully discriminated between genotypes of tea that could not be distinguished by morphological traits, correctly grouping them into China, Assam, and Cambod types.
• Progenitor Identification: AFLP data has been used to identify the likely wild progenitors of cultivated crops, such as confirming Lactuca serriola as the ancestor of cultivated lettuce and Lens culinaris ssp. orientalis as the progenitor of lentils.
22. How can researchers verify that missing bands indicate true mutations?
To verify that missing bands in an AFLP profile represent true genetic mutations rather than technical artifacts, researchers employ a combination of laboratory controls, replication, and comparative informatics.
1. Ensuring Complete Digestion
The most common cause of false polymorphisms is incomplete restriction enzyme digestion,. If DNA is not fully digested, uncut fragments may fail to amplify or produce an altered banding pattern that mimics a mutation,. Researchers prevent this by using high-purity, high-molecular-weight DNA and an excess of restriction enzymes relative to the amount of target DNA,,. Successful digestion is often verified by running a portion of the restricted DNA on an agarose gel to check for a consistent smear before proceeding to amplification,.
2. Use of Positive and Internal Controls
Researchers use specific controls to guarantee that a missing band is a result of the sample’s genotype and not a reaction failure:
• Reference Bands: In studies such as sex identification, researchers look for a reference band within the fingerprint that is less intense than the diagnostic band. If the reference band is present but the target band is missing, it confirms the reaction was successful and the absence of the band is a valid genotypic result.
• Internal Size Standards: Co-electrophoresing an internal size standard (labeled with a distinct fluorescent dye) in every lane allows researchers to correct for migration variation or gel distortions, ensuring that a “missing” band is truly absent and not simply shifted,.
• Internal PCR Controls: When AFLP markers are converted into standard PCR tests, researchers often co-amplify a known conserved fragment as an internal positive control to distinguish true absence from a failed PCR.
3. Replication and Error Tracking
Standard protocols recommend replicating approximately 20% of the samples. By comparing these replicates, researchers can calculate error rates and verify that the presence or absence of specific bands is reproducible across different batches of reactions,. Reliable AFLP markers should have an error rate lower than 5%.
4. In Silico Verification
With the increasing availability of complete genome sequences, researchers can use in silico predictor programs to simulate AFLP fragment sizes. If the laboratory fingerprints match the predicted patterns for known reference genotypes, it provides high confidence that the procedure is optimal and that any deviations in unknown samples indicate true molecular variations, such as point mutations or rearrangements,.
5. Addressing Null Alleles
A “missing” band can sometimes be a null allele, where the target DNA segment is present but fails to amplify due to a mutation at the specific 3′ primer binding site,. To verify if the underlying chromosomal region is still present, researchers can excise and sequence a related band from a different sample to design a multiplex PCR test,. These specific tests are more robust and less sensitive to minor mutations outside the immediate primer ends, allowing for more accurate verification of the mutation.
23. What role does AFLP play in tracing species’ evolutionary history?
AFLP plays a critical role in tracing the evolutionary history of species by providing high-resolution genomic fingerprints that reveal the levels of genetic diversity and phylogenetic relationships within and between taxa. Because the technique identifies naturally occurring polymorphisms scattered throughout the genome, it allows researchers to perform numerical analysis on the genetic relatedness of organisms without any prior knowledge of their DNA sequences.
The specific ways AFLP is used to reconstruct evolutionary history include:
1. Defining Common Ancestry and Differentiation
AFLP fingerprints consist of two types of informative bands:
• Conserved common bands: These define the “common roots” or common ancestors in a phylogenetic tree.
• Polymorphic bands: These define the branches of the tree, representing the genetic differentiation that occurred after divergence. By using similarity matrices and hierarchical clustering (such as the UPGMA method), researchers can construct dendrograms that visually represent the evolutionary paths and relatedness of different strains or species.
2. Identifying Progenitor Species
AFLP analysis is highly effective at identifying the wild ancestors of modern cultivated crops. For example, AFLP data provided strong support for designating Lactuca serriola as the progenitor species of cultivated lettuce. Similarly, it helped confirm Lens culinaris spp. orientalis as the likely wild progenitor of cultivated lentils.
3. Establishing Biogeographic Patterns
The technique is used to infer biogeographic patterns and the geographic origins of gene pools. By comparing the fingerprints of different populations, researchers can trace historical movements and introduction routes:
• Tea (Camellia sinensis): AFLP analysis showed that tea genotypes from Kenya clustered closely with Indian clones, providing evidence of their common ancestry and the Indian origin of Kenyan tea.
• Moringa (Moringa oleifera): Studies of this multipurpose tree suggested at least two distinct sources of germplasm introduction to Kenya from India.
• Einkorn Wheat: AFLP helped identify the specific site of einkorn wheat domestication through DNA fingerprinting.
4. Delineating Genomic Species and Subspecies
AFLP is used to define taxonomic boundaries where morphological features are insufficient. In microbiology, it has been used to delineate genomic species within complex genera like Aeromonas and Acinetobacter, showing a high correlation with the “gold standard” of DNA-DNA hybridization. It can even distinguish between strains at the subspecies or infrasubspecific level, such as in Paenibacillus and Chlamydia psittaci.
5. Estimating Nuclear Genome Divergence
Unlike mitochondrial DNA, which only reflects maternal lineage, AFLP provides a more comprehensive estimate of divergence in nuclear genomes. This makes it particularly sensitive for estimating the divergence of related species, such as comparing wild and domestic cattle. It is also valuable in molecular systematics to understand how reproductive isolation leads to the accumulation of mutations over time.
24. Are there specific genomes where AFLP outperforms other marker systems?
AFLP outperforms other molecular marker systems in several specific genomic contexts, particularly when researchers are working with unsequenced genomes, genetically uniform species, or complex genomes with high repetitive sequences. While techniques like microsatellites or RFLP may be limited by a lack of prior sequence information or low polymorphism, AFLP’s ability to scan a large percentage of the genome simultaneously makes it a superior choice in the following scenarios:
1. Genetically Uniform or Monomorphic Species
AFLP is uniquely effective for typing genetically monomorphic bacterial species, such as Bacillus anthracis. Because these species exhibit extremely low molecular variation, traditional markers often fail to find differences; however, AFLP’s multi-locus nature allows it to inspect a large percentage of the genome, enabling researchers to detect rare molecular variations that remain stable for decades.
2. Unsequenced or Poorly Characterized Genomes
Unlike microsatellites (SSRs), which require extensive sequence data and expensive primer development, AFLP is a “ready to use” technology for any species. It outperforms other systems in research involving minor or exotic taxa where no prior genomic information, probes, or libraries exist.
3. Closely Related Varieties and Cultivars
The technique provides higher resolution and a higher “marker index” (overall efficiency) than RAPD or RFLP when distinguishing between closely related species, varieties, or cultivars.
• Soybean: In studies of cultivated and wild soybean genotypes, AFLP was found to have a marker index almost an order of magnitude higher than other assays due to its high multiplex ratio.
• Tea: AFLP successfully discriminated between tea genotypes (Camellia sinensis) that were indistinguishable through phenotypic or morphological features.
• Lettuce: AFLP provided a more definitive grouping of accessions than RFLP, particularly in defining the phylogenetic relationship between cultivated lettuce and its wild progenitors.
4. Complex Genomes with High Repetition
In the complex genomes of higher plants, which contain high numbers of repeated sequences, the standard linear correlation between genome size and the number of fragments is often lost. AFLP remains highly effective here because it identifies multicopy restriction fragments that appear as intense, identifiable landmarks, helping to bridge the gap between genetic and physical maps.
5. Genomes with Specific Base Compositions (AT/GC-rich)
AFLP is highly adaptable to genomes with extreme nucleotide distributions:
• AT-Rich Genomes: The combination of EcoRI and MseI is particularly suited for AT-rich eukaryotes, such as the malaria parasite Plasmodium falciparum (which has an 80% AT content).
• GC-Rich Genomes: For GC-rich bacterial genomes (e.g., Xanthomonas), researchers can optimize performance by using different enzyme combinations like PstI and TaqI, which provide more evenly distributed banding patterns than standard enzymes.
6. Filling Gaps in Existing Genetic Maps
AFLP has proven superior at saturating chromosome segments where other markers fail. In mapping studies for barley and sugar beet, AFLP markers successfully targeted regions such as chromosome tips and internal gaps where no RFLP loci had previously been mapped.
Comparison Summary
| Marker System | AFLP Performance Advantage | Source |
|---|---|---|
| RAPD | Superior reproducibility due to higher stringency and longer primers. | |
| RFLP | Much higher efficiency; detects 100–200 loci per reaction vs. only a few. | |
| Microsatellites | Better for unsequenced genomes; higher multiplex ratio per reaction. | |
| Mitochondrial DNA | More sensitive for estimating nuclear divergence in related animal species. |
25. What are the common causes of false polymorphisms in results?
The most common cause of false polymorphisms in AFLP results is incomplete restriction enzyme digestion of the genomic DNA,,. When DNA is not fully digested, uncut or partially cut fragments generate altered banding patterns—predominantly high-molecular-weight fragments—that can be misinterpreted as true genetic variation,,.
Several technical and biological factors contribute to these inaccuracies:
• DNA Quality and Purity: AFLP requires high-molecular-weight, purified DNA; degraded DNA produces non-comparable profiles between individuals,,. Contaminants such as abundant capsular material in certain bacteria or secondary metabolites in plants can hinder enzyme activity and prevent complete restriction,,.
• DNA Concentration: Excessive amounts of template DNA can result in suboptimal and less reproducible patterns because the enzymes may not complete the digestion within the allotted time. Conversely, at extreme dilutions (picogram quantities), the pool of restriction fragments may no longer be random, causing variations in the resulting banding pattern.
• Star Activity: This refers to non-site-specific cutting by restriction enzymes, particularly EcoRI,. It is often induced by evaporation in PCR machines without heated lids, high glycerol concentrations, low salt, high pH, or contamination with organic solvents,,.
• PCR Variations: Although AFLP is more robust than RAPD, variations in PCR efficiency can cause fluctuations in peak heights or faint patterns, creating ambiguity during the scoring process,.
• Null Alleles: In specific applications like animal sexing, a null allele can cause a false result where a sex-specific chromosome is present, but the marker fails to amplify due to a mutation at the primer binding site,.
• Dominant Marker Scoring: Because AFLP is a dominant marker system, researchers often score the presence or absence of bands independently,. Without molecular evidence to identify which bands are alternative alleles of the same locus, this practice can inflate the number of loci and lead to an overestimation of genetic variation,.
26. Can you explain the positional cloning of genes using AFLP?
Positional cloning is a strategy used to isolate genes of interest based on their chromosomal location when the underlying protein or function of the gene is unknown. AFLP serves as a powerful enabling technology in this process because it can generate high-density genetic maps and identify landmarks that bridge the gap between genetic and physical maps.
The application of AFLP in positional cloning typically involves the following mechanisms and steps:
1. High-Density Mapping and Marker Enrichment
AFLP is used for fine-scale mapping to saturate specific chromosomal segments with a large number of markers. Because a single AFLP reaction can screen hundreds of independent loci simultaneously, researchers can rapidly identify markers that are tightly linked to a target trait, such as disease resistance. This high marker density is essential for identifying “site-saturating clones” required for isolating the gene.
2. Bulked Segregant Analysis (BSA)
Researchers often use AFLP in conjunction with Bulked Segregant Analysis to identify markers in specific genomic regions. By screening pools of DNA from individuals with contrasting phenotypes (e.g., resistant versus susceptible progeny), AFLP can efficiently identify polymorphisms that co-segregate with the gene. In tomato research, for example, approximately 42,000 AFLP loci were screened to identify three markers tightly linked to the Cf−9 gene, which provides resistance to leaf mould.
3. Chromosome Landing vs. Chromosome Walking
The density of AFLP markers often allows for a “chromosome landing” strategy rather than traditional chromosome walking.
• Chromosome Landing: This involves identifying markers so closely linked to the target locus that the distance between the marker and the gene is smaller than the insert size of genomic library clones (such as YACs or BACs). This allows researchers to “land” directly on the gene of interest without the need for multiple steps of walking along the chromosome.
• Chromosome Walking/Jumping: If markers are not immediately adjacent, the closely linked AFLP markers serve as starting points for chromosome walking or jumping through genomic libraries to reach the target sequence.
4. Use of Near-Isogenic Lines (NILs)
AFLP analysis is an ideal choice for identifying tightly linked markers by screening Near-Isogenic Lines and their recurrent parents. Since NILs are theoretically identical to their recurrent parents except for a small portion of the donor genome containing the introgressed gene, any AFLP polymorphism detected between them is likely linked to the target gene. In soybean research, AFLP has been used to detect thousands of loci in a short period, producing the clones necessary for gene cloning.
5. Isolation and Sequence Conversion
Once a tightly linked AFLP marker is identified, the specific DNA band is excised from the gel, reamplified, and sequenced. This sequence information allows researchers to develop Sequence Characterized Amplified Region (SCAR) markers or probes to screen genomic libraries and eventually isolate the exact gene.
Notable Examples of Positional Cloning with AFLP
• Arabidopsis: The TRN1 gene was isolated using a chromosome landing strategy where 26,000 AFLP fragments were screened to find four markers so close to the locus that no recombination occurred.
• Potato: High-resolution maps for the R1 locus (resistance to Phytophthora infestans) and the Gro1 locus (nematode resistance) were constructed using AFLP and RFLP markers.
• Poplar Trees: AFLP identified markers for the Mer locus, which confers resistance to leaf rust fungus.
References
Blears, M. J., De Grandis, S. A., Lee, H., & Trevors, J. T. (1998). Amplified fragment length polymorphism (AFLP): a review of the procedure and its applications. In Journal of Industrial Microbiology & Biotechnology (Vol. 21). http://www.stockton-press.co.uk/jim
Donaldson, S. L., Chopin, T., & Saunders, G. W. (1998). Amplified Fragment Length Polymorphism (AFLP) as a source of genetic markers for red algae. In Journal of Applied Phycology (Vol. 10).
Fry, N. K., Savelkoul, P. H. M., & Visca, P. (2009). Amplified fragment-length polymorphism analysis. Methods in Molecular Biology (Clifton, N.J.), 551, 89–104. https://doi.org/10.1007/978-1-60327-999-4_8
Goyat, S., Grewal, A., Hima Bindu, K., Singh, D., Katiyar, R. S., Tewari, S. K., & Nainwal, R. (2017). Amplified Fragment Length Polymorphism (AFLP) Based Genetic Diversity Studies in Betel Vine ( Piper betle L.) . East African Agricultural and Forestry Journal, 82(2–4), 118–129. https://doi.org/10.1080/00128325.2017.1364479
Griffiths, R., & Orr, K. (1999). The use of amplified fragment length polymorphism (AFLP) in the isolation of sex‐specific markers. Molecular Ecology, 8.
Koopmann, B., Tiedemann, A. V, Mutitu, E. W., & Kimenju, J. W. (2008). A review of the Amplified Fragment Length Polymorphism (AFLP) technique in genotyping and DNA fingerprinting studies [Review Article] A review of the Amplified Fragment Length Polymorphism (AFLP) technique for genotyping and DNA fingerprinting studies. In Journal of Applied Biosciences (Vol. 9, Number 2). www.biosciences.elewa.org
Liu, Z. (2007). Amplified Fragment Length Polymorphism (AFLP). In Aquaculture Genome Technologies (pp. 29–42).
Mackill, D. J., Zhang, Z., Redoiia, E. D., & Colowit, P. M. (1996). Level of polymorphism and genetic mapping of AFLP markers in rice. Genome, 39. www.nrcresearchpress.com
Masiga, D. K., Michael, C., & Turner, R. (2004). Amplified (Restriction) Fragment Length Polymorphism (AFLP) Analysis. Methods in Molecular Biology, 270.
Maughan, P. J., Maroof, M A Sagllai, Buss, G. R., Huestis, G. M., Maroof, M A Saghai, & Buss, ~) -G R. (1996). Amplified fragment length polymorphism (AFLP)in soybean: species diversity, inheritance, and near-isogenic line analysis. In Theor Appl Genet (Vol. 93).
Muluvi, G., Sprent, J., Soranzo, N., Provan, J., Odee, D., Folkard, G., McNicol, J., & Powell, W. (1999). Amplified fragment length polymorphism Moringa. Molecular Ecology, 8.
Paun, O., & Schönswetter, P. (2012). Amplified fragment length polymorphism: An invaluable fingerprinting technique for genomic, transcriptomic, and epigenetic studies. Methods in Molecular Biology, 862, 75–87. https://doi.org/10.1007/978-1-61779-609-8_7
Rana, M. K., Singh, S., & Bhat, K. V. (2004). Amplified fragment length polymorphism (AFLP) based diversity in advanced breeding lines of cotton (Gossypium hirsutum L.). In J. Genet (Vol. 64, Number 2). www.IndianJournals.com
Savelkoul, P. H. M., Aarts, H. J. M., De Haas, J., Dijkshoorn, L., Duim, B., Otsen, M., Rademaker, J. L. W., Schouls, L., & Lenstra, J. A. (1999). Amplified-Fragment Length Polymorphism Analysis: the State of an Art. In JOURNAL OF CLINICAL MICROBIOLOGY (Vol. 37, Number 10). https://journals.asm.org/journal/jcm
Sorkheh, K., Shiran, B., Aranzana, M. J., Mohammadi, S. A., Martínez-Gomez, P., & Rastilantie, M.-. (2005). Application of amplified fragment length polymorphism (AFLPs) analysis to plant breeding and genetics: Procedures, applications and prospects WFL Publisher Science and Technology. In Journal of Food, Agriculture & Environment (Vol. 5, Number 1). www.world-food.net
Srinivasan, K., & Mathivanan, N. (2009). Biological control of sunflower necrosis virus disease with powder and liquid formulations of plant growth promoting microbial consortia under field conditions. Biological Control, 51(3), 395–402. https://doi.org/10.1016/j.biocontrol.2009.07.013
Related posts:
 Polymerase Chain Reaction (PCR): The Molecular Copier That Revolutionized Modern Science
 Restriction Fragment Length Polymorphism (RFLP): Comprehensive Analysis of Molecular Markers in Genetic Mapping, Species Identification, and Clinical Diagnostics
 The Secret of the Blue and White Colonies: An Introduction to Blue-White Screening
 The Genetic Engineer’s Toolkit: A Beginner’s Guide to Cloning Vectors
 Molecular Scissors: An Introduction to Restriction Enzymes

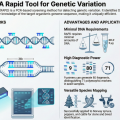
Pingback: Molecular Markers in Genetic Analysis and Marker-Assisted Selection: A Comprehensive Professional Resource - Aneknowledge.com