1. Introduction to Electrophoretic Separation in Biotechnology
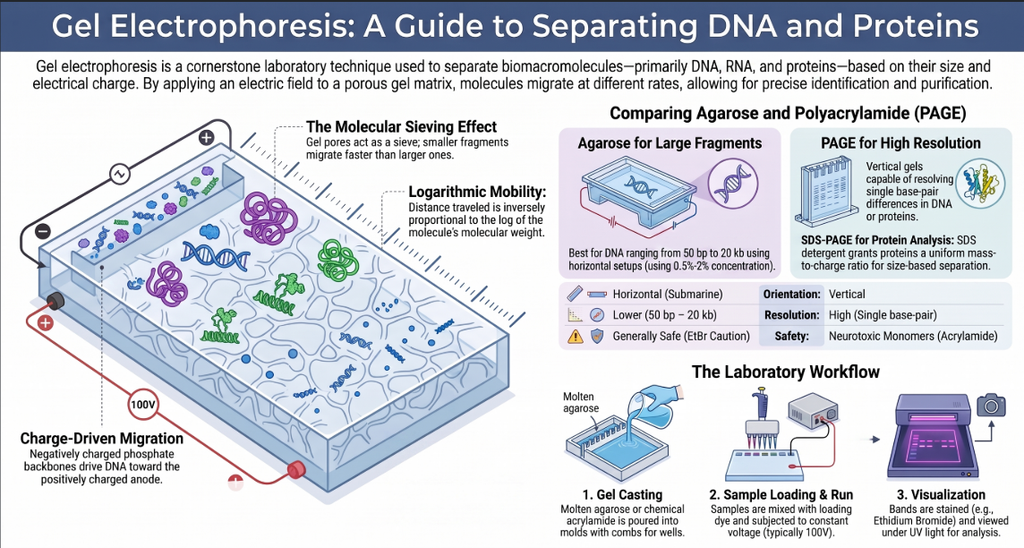
In the landscape of modern biotechnology, gel electrophoresis stands as a strategic cornerstone for the characterization and quality control of complex biological molecules. This technique leverages the physical properties of analytes—specifically their charge, size, and conformation—to achieve precise separation within a supporting matrix. Whether evaluating the structural integrity of a gene therapy vector or the subunit composition of a therapeutic protein, the ability to resolve molecular fragments with high fidelity is essential for both basic research and the commercial development of life-saving therapeutics.
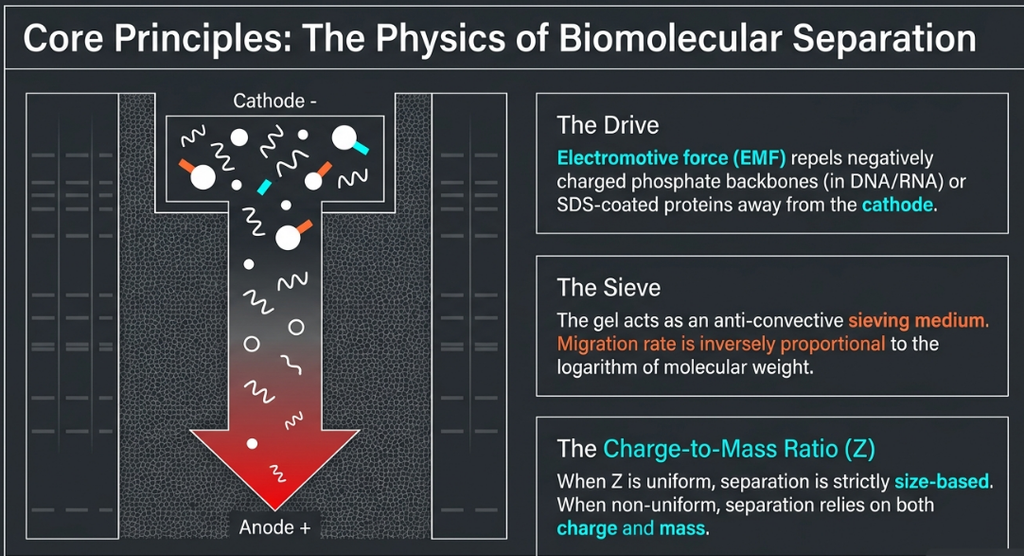
The process is defined by two critical components:
- The Electric Field: This provides the “push,” or the electromotive force, required to drive the molecules through the system.
- The Gel Matrix: This is not merely a container; it is an adjustable “sieve.” Without a matrix, molecules in a pure liquid would migrate at rates determined largely by their charge-to-mass ratio. The matrix provides physical resistance, ensuring that separation is a function of the molecule’s physical properties.
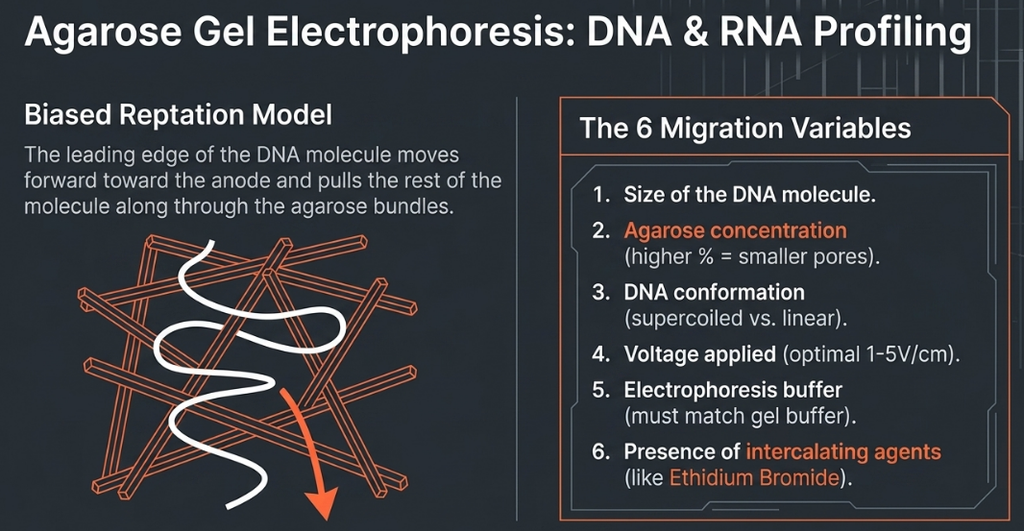
This guide provides a detailed technical overview of the primary electrophoretic methodologies. We will examine the distinct advantages of agarose versus polyacrylamide matrices, the application of the novel MSRE-AGE method for DNA Methylation analysis, and the standardized implementation of SDS-PAGE for protein mass estimation. By understanding these diverse approaches, laboratory professionals can ensure the accuracy and reproducibility required for manufactured biological products. The following analysis begins with a fundamental comparison of the chemical matrices used to facilitate these separations.
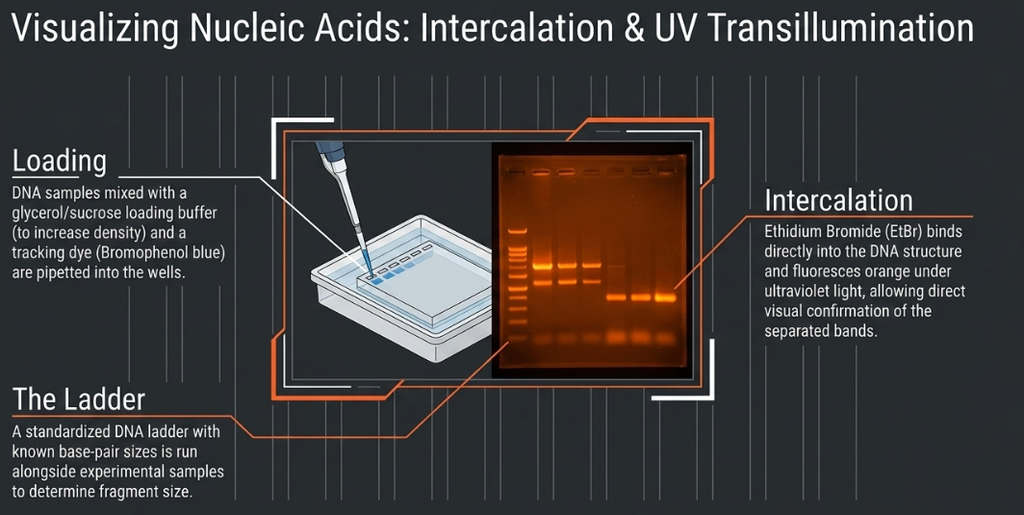
2. Comparative Analysis: Agarose vs. Polyacrylamide Matrices
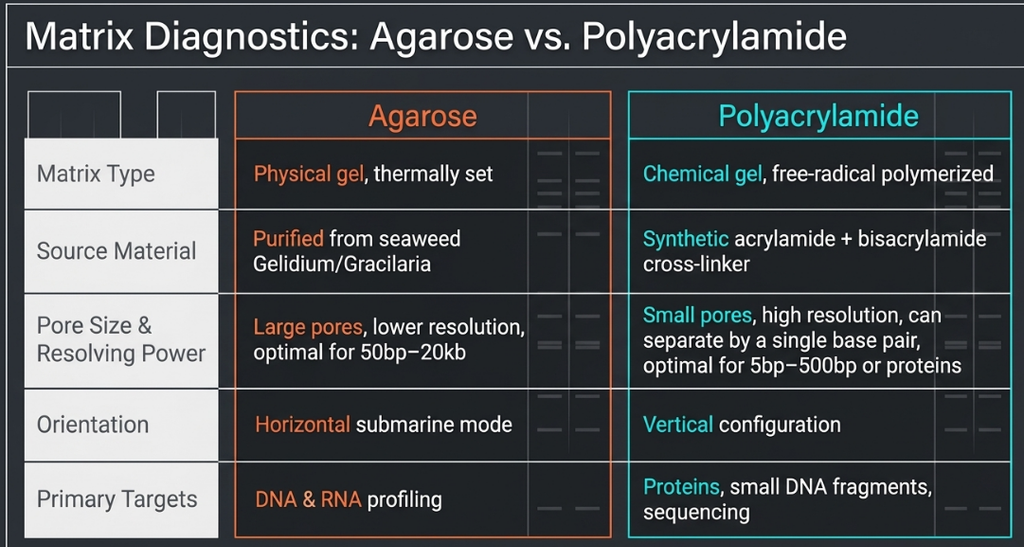
Strategic matrix selection is the first critical step in achieving the resolution and sample purity required for specific molecular assays. While both agarose and polyacrylamide serve as molecular sieves, their physical properties dictate their utility for different sizes and types of nucleic acids. Agarose is typically utilized for larger DNA molecules, such as plasmids, due to its larger pore size and ease of handling. Conversely, polyacrylamide provides significantly higher resolution for smaller fragments.
| Criteria | Agarose Gel Electrophoresis (AGE) | Polyacrylamide Gel Electrophoresis (PAGE) |
|---|---|---|
| Physical Nature | A seaweed-derived polysaccharide; forms a matrix via physical gelation (non-covalent). | A chemically cross-linked network of acrylamide and bisacrylamide. |
| Pore Characteristics | Relatively large pores; ideal for macroscopic separation. | High-density, adjustable ribbon-like network; provides exceptional resolution. |
| Resolving Power | Sufficient for large plasmids and genomic fragments. | Extremely high; resolves fragments differing by as little as 0.1% (e.g., 1 bp in 1000 bp). |
| Loading Capacity | Standard capacity for diagnostic DNA analysis. | High; can accommodate up to 10 µg of DNA in a single 1 cm x 1 mm slot without loss of resolution. |
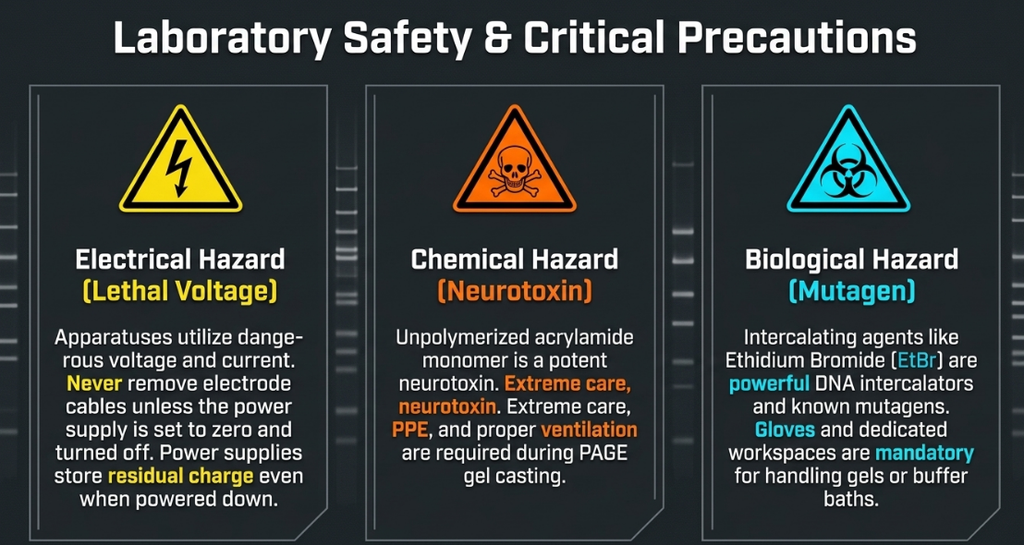
| Ease of Preparation | Simple to cast and handle. | More difficult to prepare; involves hazardous neurotoxins (acrylamide). |
| Primary Applications | Routine DNA analysis, plasmid linearization, and large pDNA. | High-purity recovery (e.g., microinjection), small fragments (6–2000 bp), and single-strand analysis. |
Choosing the correct matrix is the foundation upon which more specialized techniques, such as the analysis of epigenetic markers, are built.
3. Advanced DNA Analysis: The MSRE-AGE Method for CpG Methylation
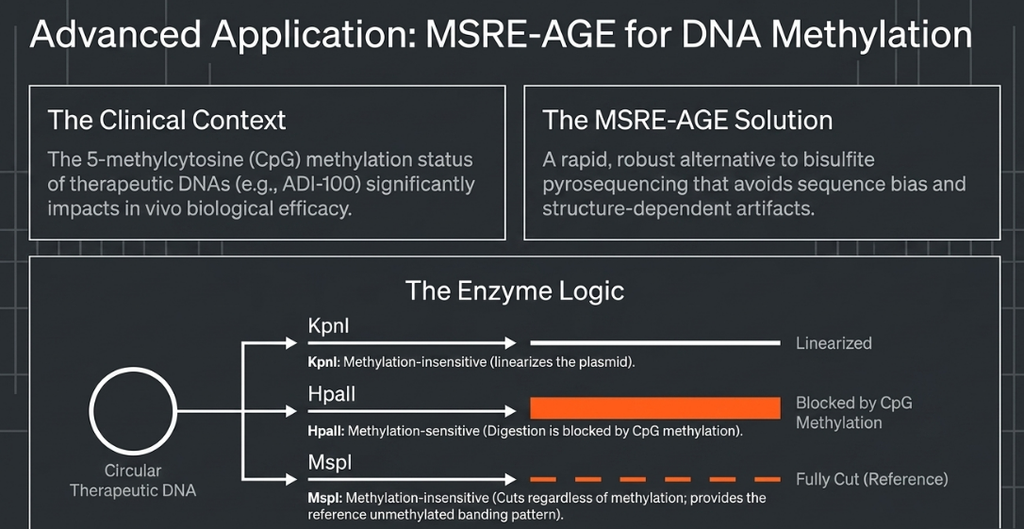
The assessment of 5-methylcytosine at CpG sites is a critical quality control parameter for therapeutic DNAs. For drug candidates like ADI-100—an immune tolerance-inducing agent—the methylation status directly influences biological activity. The Methylation-Sensitive Restriction Enzyme Digest and Agarose Gel Electrophoresis (MSRE-AGE) method offers a robust alternative to bisulfite pyrosequencing, particularly for synthetic closed-linear DNA such as Doggybone DNA (dbDNA). MSRE-AGE is specifically valued for avoiding structure-dependent artifacts and sequence pitfalls common in bisulfite-based analysis of these complex molecules.
Method Principle
MSRE-AGE utilizes the differential cutting capabilities of specific restriction enzymes to reveal epigenetic states:
| Enzyme | Target Site | Methylation Sensitivity | Strategic Role |
|---|---|---|---|
| KpnI-HF | GGTAC^C | Insensitive | Linearization (pDNA Only): Converts circular templates into linear forms. |
| HpaII | C^CGG | Sensitive: Blocked by CpG methylation | Assessment: Cleavage indicates hypomethylation; resistance indicates methylation. |
| MspI | C^CGG | Insensitive | Reference: Generates a pattern equivalent to a fully unmethylated control. |
Critical Analytical Parameters
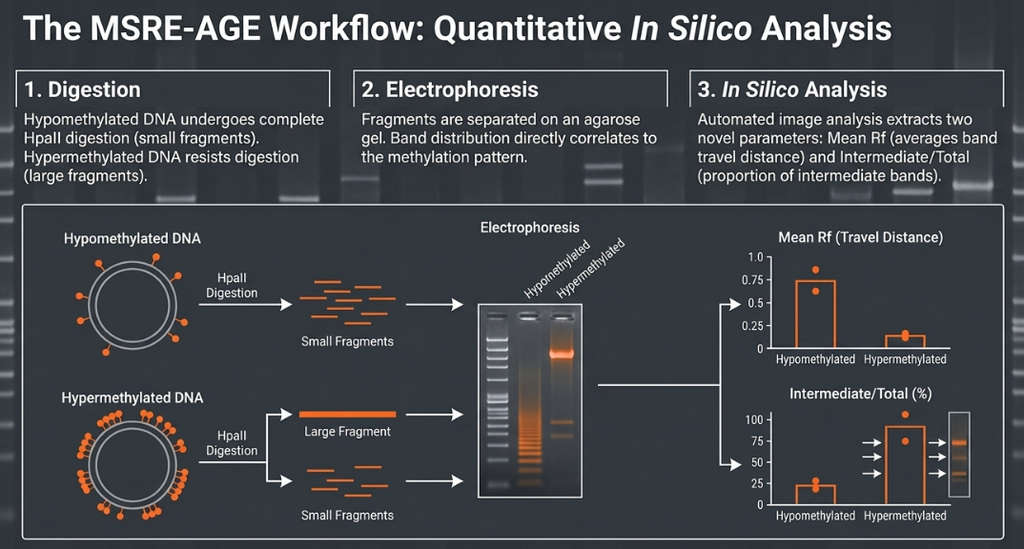
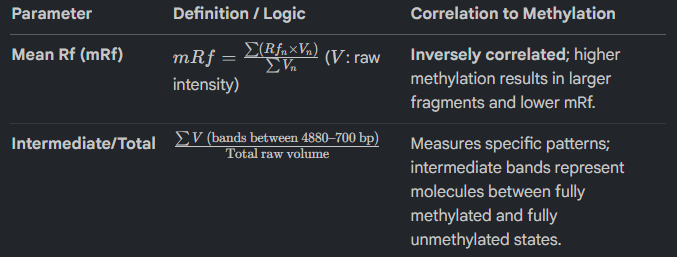
Two primary parameters are derived from the resulting electrophoretic bands using custom in silico analysis:
1. Mean Rf (mRf): Measures average migration distance, which inversely correlates with methylation levels. It is calculated using the following formula:
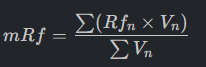
(Where Rf is the retardation factor and V is the raw volume/intensity of each detected band).
2. Intermediate/Total Ratio: Quantifies methylation patterns by measuring the proportion of band intensity found between fully methylated (e.g., 4880 bp) and fully unmethylated (≤ 700 bp) states:

While MSRE-AGE excels in therapeutic DNA profiling, many applications require the even higher resolution and purity provided by polyacrylamide.
4. High-Resolution Nucleic Acid Separation: Polyacrylamide Gel Electrophoresis (PAGE)
For demanding purposes like the microinjection of embryos, PAGE is mandatory due to its superior purity and near-single-base resolution.
4.1 Polymerization Chemistry
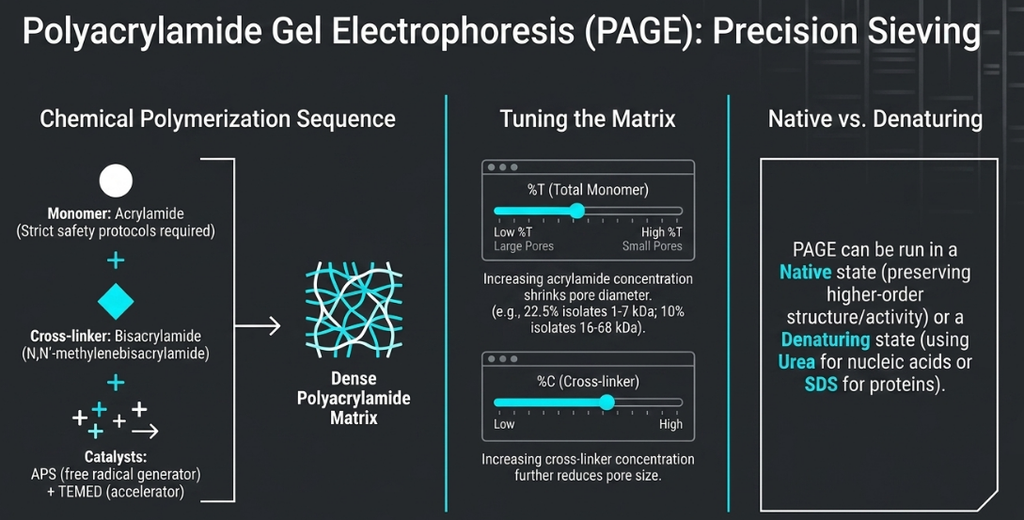
PAGE matrices are formed via the vinyl polymerization of acrylamide monomers cross-linked by N,N’-methylenebisacrylamide. The pore size is determined by two factors: %T, the total concentration of monomer (acrylamide + crosslinker), and %C, the percentage of that total monomer that is crosslinker. The reaction is driven by:
- Ammonium Persulfate (APS): The catalyst that generates free radicals via an oxido-reduction reaction.
- TEMED: The adjunct catalyst required to initiate the process.
The Catalytic Spark: The Roles of APS and TEMED
The polymerization of the acrylamide/bisacrylamide solution is an oxido-reduction reaction driven by the generation of free radicals. This process is initiated by the interaction of an initiator and an adjunct catalyst.
- Reduction of the Initiator: TEMED (N,N,N’,N’-tetramethylethylenediamine) acts as the adjunct catalyst, reducing the Ammonium Persulfate (APS).
- Generation of Free Radicals: This reduction triggers the decomposition of APS into sulfate free radicals SO4– .
- Initiation of Polymerization: These highly reactive SO4– radicals attack the vinyl groups of the acrylamide monomers, initiating a chain reaction that continues until the monomers are exhausted or the reaction is quenched.
[!CAUTION] A Note on Reagent Stability APS is chemically unstable in aqueous solution and spontaneously decays into SO4– ions over time. If this decay occurs during storage, the potential energy required to drive polymerization is spent before the reagent ever reaches the monomer mix. Therefore, APS solutions must be prepared fresh (ideally weekly). To maintain catalytic efficacy, TEMED must be stored at 4°C.
Managing the Environment: Oxygen and Polymerization Inhibitors
The presence of atmospheric oxygen is a significant inhibitor of polyacrylamide polymerization. Oxygen molecules diffuse into the monomer solution and scavenge the free radicals produced by the APS/TEMED reaction, preventing the formation of a solid matrix at the air-liquid interface.
To ensure a sharp, uniform interface for the resolving gel, an “overlay” must be applied immediately after pouring. The choice of overlay is dictated by the acrylamide concentration:
- For gels containing ≤8% acrylamide: A layer of 0.1% SDS is used.
- For gels containing ≥10% acrylamide: Water-saturated isobutanol is the preferred barrier.
[!TIP] To achieve the perfectly flat interface necessary for sharp molecular bands, always verify the gel apparatus is level with a spirit level before pouring the overlay. This prevents the formation of “swirls” or slanted interfaces that can distort migration data.
4.2 Materials and Staining Protocol
- Reagents: Acrylamide:Bisacrylamide (typically 29:1), TBE buffer (0.5x or 1x).
| Reagent Name | Structural Role in Gel Formation |
|---|---|
| Acrylamide | The primary monomer that undergoes vinyl polymerization to form long, linear polyacrylamide chains. |
| N,N′-methylenebisacrylamide (Bisacrylamide) | A bifunctional cross-linking agent that creates covalent “bridges” between linear chains, transforming the solution into a 3D ribbon-like network. |
- Staining Warning: Ethidium Bromide, SYBR Green I, and Methylene Blue must not be incorporated into the gel during polymerization. These dyes inhibit the polymerization process; therefore, PAGE gels must be stained post-electrophoresis.
4.3 Nondenaturing vs. Denaturing PAGE
- Nondenaturing PAGE: Separates double-stranded DNA based on size and conformation. Mobility can vary by 10% based on base composition.
- Denaturing PAGE: Uses urea or formamide to suppress base-pairing, allowing single-stranded DNA to migrate almost entirely based on size, independent of sequence.
Functional Reagents and Stability Warnings
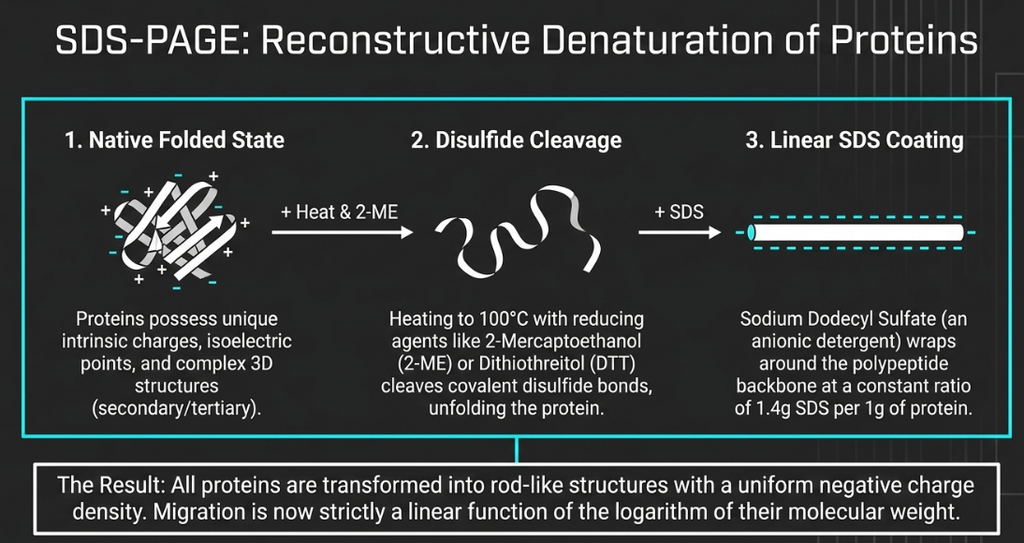
- SDS: This anionic detergent denatures secondary and non-disulfide-linked tertiary structures, coating the protein in a uniform negative charge.
- Reducing Agents (DTT or 2-mercaptoethanol): Essential for breaking disulfide bonds to ensure proteins migrate as primary structures. CRITICAL: These must be added to the sample buffer just prior to use due to their chemical instability.
- APS & TEMED: Catalyst and adjunct for radical-driven polymerization.
4.4 Comparative Analysis: Polyacrylamide vs. Agarose
- Resolving Power: Distinguishes 1 bp differences in 1000 bp fragments.
- DNA Capacity: Supports high-mass loading (up to 10 µg per slot) without resolution loss.
- Recovery Purity: Yields exceptionally pure DNA, ideal for sensitive applications like microinjection.
| Acrylamide Concentration (%) | Effective Range of Separation (bp) |
|---|---|
| 3.5% | 1,000 – 2,000 |
| 5.0% | 80 – 500 |
| 8.0% | 60 – 400 |
| 12.0% | 40 – 200 |
| 15.0% | 25 – 150 |
| 20.0% | 6 – 100 |
5. Protein Characterization: SDS-Polyacrylamide Gel Electrophoresis (SDS-PAGE)
SDS-PAGE is the standard for determining subunit composition, sample homogeneity, and molecular mass estimation.
The Laemmli Method and the Role of SDS
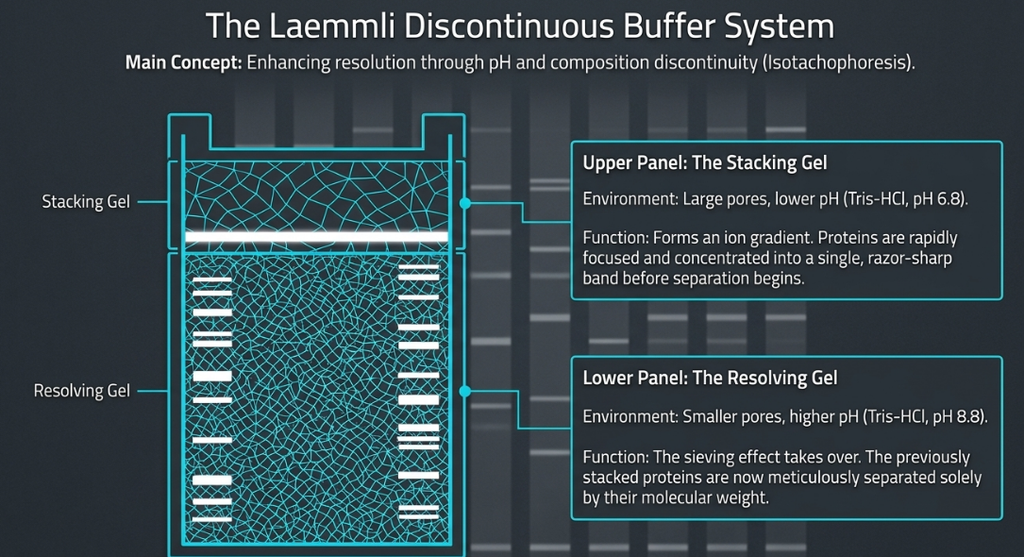
Sodium Dodecyl Sulfate (SDS) is an anionic detergent that denatures proteins into linear molecules and imparts a uniform negative charge proportional to mass. This ensures migration toward the anode is dictated strictly by molecular weight. The system utilizes a low-concentration Stacking Gel to concentrate samples and a higher-concentration Resolving Gel for separation.
Protocol Architecture
- Stacking Gel: A low-concentration layer that concentrates the sample into a sharp starting zone.
- Resolving Gel: The separation matrix where the actual resolution occurs.
- The Overlay: To prevent oxygen from inhibiting polymerization at the interface, an overlay is essential. Use 0.1% SDS for gels ≤8% acrylamide and saturated isobutanol for gels >10% acrylamide.
The Functional Detergent: The Role of SDS
In SDS-PAGE systems, Sodium Dodecyl Sulfate (SDS) is added to ensure that protein migration is a function of mass rather than shape or intrinsic charge. SDS is an anionic detergent that performs three critical functions:
- Solubilization: It dissolves hydrophobic molecules, ensuring complex protein mixtures remain in the aqueous phase.
- Denaturation: SDS disrupts secondary and non-disulfide-linked tertiary structures, unfolding proteins into linear chains.
- Charge Standardization: SDS coats the unfolded proteins at a constant ratio, imparting a large, uniform negative charge proportional to the protein’s mass.
In practice, SDS works in tandem with reducing agents such as Dithiothreitol (DTT) or 2-mercaptoethanol. While SDS unfolds the protein, these reducing agents break the disulfide bonds that maintain tertiary and quaternary structure. Together, they ensure the protein exists in a “primary structure only” state. Consequently, the sieving effect of the gel becomes the sole determinant of migration, allowing for accurate molecular weight estimation.
Recommended Gel Percentages
The following table provides guidelines for matching acrylamide concentration to the target protein’s molecular weight range:
| Protein Mol. Wt. Range (kDa) | Recommended Gel % (Linear) | Recommended Gel % (Gradient) |
|---|---|---|
| 100 – 400 | 4% | 4–12% (for 30–300 kDa) |
| 40 – 250 | 8% | 4–20% (for 5–300 kDa) |
| 30 – 200 | 10% | 8–16% (for 10–200 kDa) |
| 10 – 80 | 14% | 10–20% (for 5–100 kDa) |
| 5 – 50 | 18% | — |
Operational Parameters
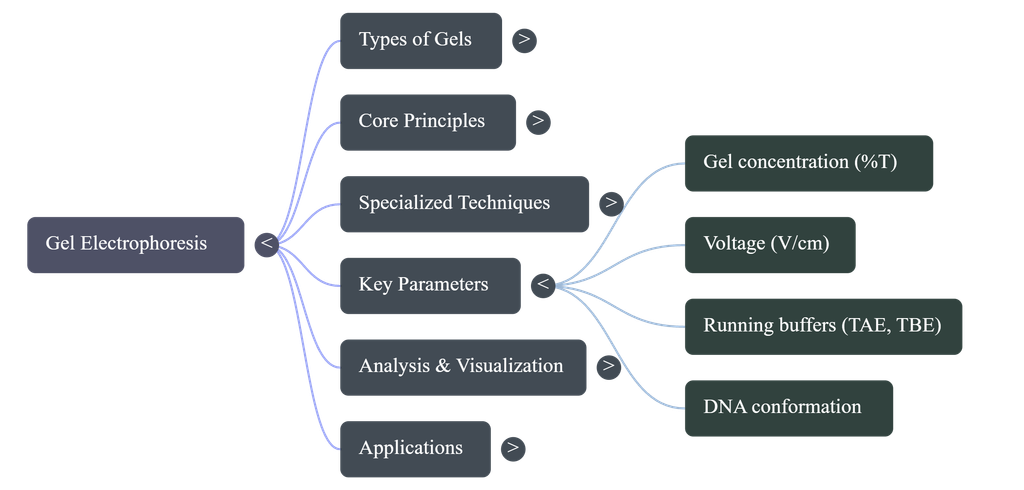
- Buffer Capacity: Use TBE for runs exceeding 8 hours to maintain buffering capacity.
- Voltage Regulation: Run at 1–8 V/cm. Higher voltages cause “Joulic heating,” which can denature small fragments and cause “smiling” bands.
- Sequence Sensitivity: In polyacrylamide, mobility is affected by both size and base composition; sequence variations can cause a 10% variance in mobility for fragments of identical length. This must be accounted for during band identification.
6. Laboratory Quality Control: Troubleshooting and Mobility Calculations
Reproducibility is paramount in the manufacturing of therapeutic DNAs. Specialists must ensure that the same batch of 5x TBE buffer is used for both the gel and the reservoir, as slight differences in ionic strength can create buffer fronts that distort migration.
Calculating Molecular Mass
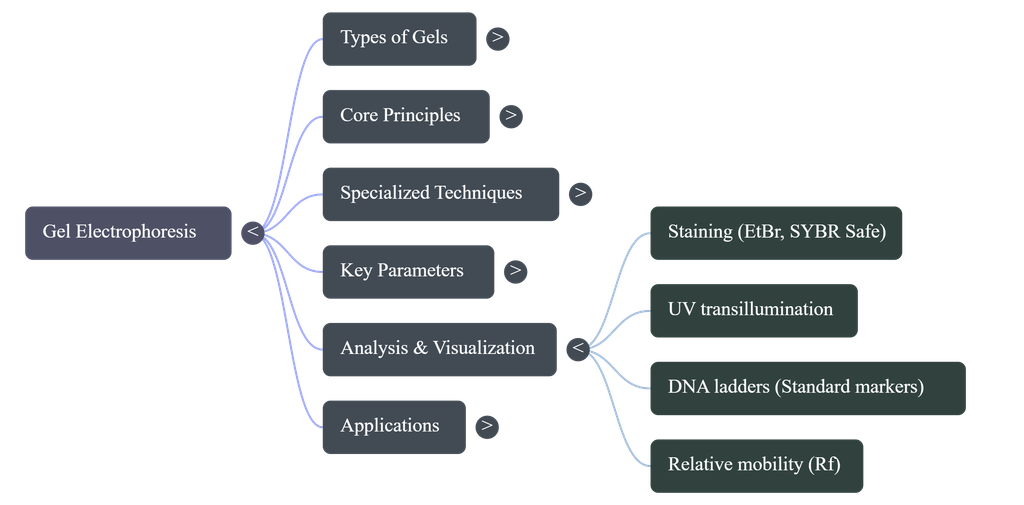
1. Calculate Relative Mobility (Rf):

2. Generate Standard Curve: Plot log(mass) on the y-axis vs. Rf of standards on the x-axis.
3. Linear Regression: Use y=mx+b to solve for the unknown mass.
Troubleshooting Guide
| Observation | Probable Root Cause | Impact on Data | Corrective Action |
|---|---|---|---|
| Vertical Streaking | Sample overload or precipitation. | Inaccurate raw volume (integrated intensity) calculation. | Dilute sample; centrifuge before loading. |
| “Smile Effect” | Uneven heating (center is hotter). | Non-uniform Rf values across lanes; false-positive size shifts. | Reduce voltage/power setting; check buffer concentration. |
| Doublet Bands | Partial re-oxidation of proteins. | Error in data analysis | Ensure fresh DTT/2-mercaptoethanol in buffer. |
| Base of well dragged down | High concentration of nucleic acids. | Error in data analysis | Reduce DNA load or treat for nucleic acid removal. |
| Extra Protein Bands | Endogenous proteolysis. | Error in data analysis | Immediate boiling (100°C for 5 min) is non-negotiable. |
| Skewed/Distorted Bands | Poor polymerization around wells | Corrupts linear regression; inaccurate molecular weight. | Increase APS and TEMED concentrations by 25% |
| Failure/Slow Polymerization | Gel takes too long or does not set | Gel does not set | Increase APS and TEMED concentrations by 50% or use fresh reagents |
| Bands Non-migratory in Portions | Air bubbles trapped between glass plates or under the gel; chipped plates. | Segmented data loss; impossible to calculate mRf for affected lanes. | Snag bubbles with polypropylene tubing; inspect plates for flaws before casting. |
| Lateral Band Spreading | Sample diffusion before power-up; slow migration through stacking gel. | Loss of resolution; overlapping bands; quantification failure. | Minimize time between loading and power-up; increase voltage 25% during stacking. |
Expert Limitation Note: “Since SDS-PAGE separates proteins based on their primary structure by size, not amino acid sequence, two different proteins of 500 amino acids will travel through the gel in a mixed band and would not be separated from each other by this method.”
6.1 Sample Integrity and Degradation Protocols
Even a perfectly cast gel cannot compensate for biological material compromised by degradation or improper chemical reduction. As Laboratory Technical Director, I insist on strict adherence to the following protocols, alongside rigorous safety compliance. Caution: Consult Material Safety Data Sheets (MSDS) for SDS (hazardous dust) and Acrylamide (potent neurotoxin/absorbed through skin) before preparation.
Prevention of Proteolysis
Protein degradation is typically identified by extra, unexpected bands or a heavy accumulation of polypeptides at the dye front. To prevent proteolysis, heat samples immediately upon dilution in SDS sample buffer. Endogenous proteases remain highly active in SDS buffer until denatured by heat (typically 100°C for 5 minutes). Failure to heat immediately can lead to total sample loss, especially if kept at room temperature.
Reduction and Aggregation Failures
Effective separation in SDS-PAGE requires the complete dissociation of disulfide bonds using 2-mercaptoethanol or Dithiothreitol (DTT).
- Doublets: If a single protein appears as two bands, it suggests the sample has re-oxidized or was insufficiently reduced. Prepare fresh sample solution with fresh reducing agent.
- High-Molecular-Weight Aggregates: Insufficient reduction or certain samples that aggregate when boiled (requiring 60°C treatment instead) can cause heavily stained bands at the gel origin that fail to enter the resolving gel.
In quantitative assays like MSRE-AGE, sample overload can cause streaks that skew the Intermediate/Total ratio, obscuring non-abundant polypeptides and compromising the assessment of methylation patterns.
6.2 Systemic Operational Failures: Buffer and Matrix Dynamics
The electrophoresis buffer and the gel matrix constitute a single, integrated electrical circuit that must remain stable. Any ionic instability will result in systemic failure.
Polymerization Inefficiencies
Polymerization is driven by free radicals from Ammonium Persulfate (APS) and catalyzed by TEMED.
- Swirls in Gel: Indicates excessive catalysis (polymerization <15 minutes). Reduce APS and TEMED by 25%.
- Soft Gels: Often the result of poor-quality reagents or incorrect %C. If polymerization takes >60 minutes, increase catalyst concentrations or use fresh reagents.
- Webbing in Wells: Usually caused by a loose-fitting comb or a polymerization rate that is too rapid.
Buffer Inconsistency and Ionic Imbalance
Ionic strength and pH must be identical in both the reservoirs and the gel matrix. Non-negotiable: Prepare gel solutions and electrophoresis buffers from the same concentrated stock.
- TBE Stability: Prefer 5x TBE stock solutions over 10x, as 10x is prone to solute precipitation during storage.
- Filtration: Always pass buffer stocks through a 0.22-μm filter to prevent precipitate-induced artifacts and “buffer fronts” that distort migration.
- Buffer Capacity: For runs exceeding 8 hours, 1x TBE is mandatory. Its superior buffering capacity prevents the denaturation of small DNA fragments caused by Joulic heating.
6.3 Expert Protocol for Continuous Laboratory Optimization
Transitioning from reactive troubleshooting to proactive quality assurance requires the institutionalization of the following standards:
- Reagent Filtration: Filter all gel reagents to eliminate insoluble material that causes inconsistent pore sizes.
- Standardized Loading: Maintain uniform final concentrations (e.g., 2 mg/ml for proteins) to ensure even migration across the slab.
- Thermal Monitoring: Use TLC indicators or built-in sensors. If temperatures spike, reduce voltage immediately to prevent “smiling.”
- Plate Integrity: Clean glass plates with detergent until they drain without water spots. Rinse with 70% ethanol.
- Sigmacote Application: Treat one plate with siliconizing fluid (e.g., Sigmacote) to prevent the gel from sticking or tearing during disassembly—a critical step for high-resolution recovery.
- Buffer Management: Use only fresh APS (prepared weekly) and store TEMED at 4°C to ensure consistent polymerization rates.
7. Conclusion and Strategic Summary
Gel electrophoresis remains an indispensable suite of methodologies for the modern molecular specialist. From the rapid assessment of CpG methylation levels via MSRE-AGE to the high-resolution purification offered by PAGE and the mass estimation of SDS-PAGE, these tools provide the quantitative data necessary for therapeutic manufacturing. Selecting the appropriate matrix (AGE vs. PAGE) and separation conditions is critical to the accuracy of any molecular diagnostic. Researchers are encouraged to integrate custom in silico band analysis to move toward precise, quantitative molecular biology.
Image Summary

References
Bhilocha, S., Ripal, A., Pandya, M., Yuan, H., Tank, M., LoBello, J., Shytuhina, A., Wang, W., Wisniewski, H. G., De La Motte, C., & Cowman, M. K. (2011). Agarose and polyacrylamide gel electrophoresis methods for molecular mass analysis of 5- to 500-kDa hyaluronan. Analytical Biochemistry, 417(1), 41–49. https://doi.org/10.1016/j.ab.2011.05.026
Carter, M., Essner, R., Goldstein, N., & Iyer, M. (2022). Molecular Cloning and Recombinant DNA Technology. In Guide to Research Techniques in Neuroscience (pp. 227–243). Elsevier. https://doi.org/10.1016/b978-0-12-818646-6.00014-2
Chrambach, A., & Rodbard, D. (1971). Polyacrylamide Gel Electrophoresis. Science, 172, 440–451.
Gallagher, S. R. (2012). SDS-polyacrylamide gel electrophoresis (SDS-PAGE). Current Protocols in Essential Laboratory Techniques, 2012(SUPPL.6). https://doi.org/10.1002/9780470089941.et0703s06
Green, M. R., & Sambrook, J. (2020). Polyacrylamide Gel Electrophoresis. Cold Spring Harbor Protocols, 2020(12), 525–532. https://doi.org/10.1101/pdb.prot100412
Guttman, A., & Auer, F. (2026). Capillary gel electrophoresis. In Advances in Microscale Electro- and Liquid Phase-Based Separation Techniques (pp. 115–130). Elsevier. https://doi.org/10.1016/B978-0-443-34209-7.00005-4
Lee, P. Y., Costumbrado, J., Hsu, C. Y., & Kim, Y. H. (2012). Agarose gel electrophoresis for the separation of DNA fragments. Journal of Visualized Experiments, (62). https://doi.org/10.3791/3923
Manns, J. M. (2011). SDS-polyacrylamide gel electrophoresis (SDS-PAGE) of proteins. Current Protocols in Microbiology, (SUPPL. 22). https://doi.org/10.1002/9780471729259.mca03ms22
Nagy, K., & Vékey, K. (2008). Separation methods. In Medical Applications of Mass Spectrometry (pp. 61–92).
Packirisamy, V., & Pandurangan, P. (2023). Polyacrylamide gel electrophoresis: a versatile tool for the separation of nanoclusters. In BioTechniques (Vol. 74, Number 1, pp. 51–62). Taylor and Francis Ltd. https://doi.org/10.2144/BTN-2022-0086
Paliza-Carre, M., Chen, G., & Shabahang, S. (2026). A simple and rapid agarose gel electrophoresis method to assess CpG methylation of DNA. BioTechniques, 78(1–12), 170–182. https://doi.org/10.1080/07366205.2026.2656194
Sambrook, J., & Russell, D. W. (2006). SDS-Polyacrylamide Gel Electrophoresis of Proteins. Cold Spring Harbor Protocols, 2006(4), pdb.prot4540. https://doi.org/10.1101/pdb.prot4540
Sowersby, D. S., & Lewis, L. K. (2024). SURE gel electrophoresis: A method for improved detection and purification of dilute nucleic acid samples. Analytical Biochemistry, 684. https://doi.org/10.1016/j.ab.2023.115373
Sun, W. (2009). General procedures. In Molecular Diagnostics: Techniques and Applications for the Clinical Laboratory (pp. 49–57). Elsevier. https://doi.org/10.1016/B978-0-12-369428-7.00005-7
Wittmeier, P., & Hummel, S. (2022). Agarose gel electrophoresis to assess PCR product yield: comparison with spectrophotometry, fluorometry and qPCR. BioTechniques, 72(4), 155–158. https://doi.org/10.2144/btn-2021-0094


Related posts:
 Southern Blotting: A Comprehensive Guide to Molecular DNA Analysis and Protocol Principles
 Polymerase Chain Reaction (PCR): The Molecular Copier That Revolutionized Modern Science
 Calculation for PCR Composition
 The Blueprint of Life: An Introduction to DNA’s Structure
 The Amazing World of RNA: Life’s Versatile Molecule