1. Introduction to the Southern Blot Technique
Southern blotting stands as a foundational pillar of molecular biology, providing a robust methodology for identifying specific DNA sequences within complex genomic samples. While modern high-throughput methods offer speed, this technique remains essential for providing a “macro-view” of genomic architecture—such as large-scale rearrangements and transgene clusters—that short-read Next-Generation Sequencing (NGS) often struggles to assemble accurately. The Southern blotting protocol integrates physical separation via electrophoresis with sequence-specific molecular hybridization and membrane transfer. This synergy allows for the precise visualization and quantification of targets in DNA analysis. Developed in the mid-1970s, the technique bears the name of its creator, Edwin Southern, whose eponymous method transitioned genetic research from bulk biochemical analysis to the high-resolution study of specific gene structures.

The Problem vs. The Solution
| The Problem | The Solution: Southern Blotting |
|---|---|
| Complexity: Genomic DNA is too massive to analyze as one piece; it must be broken into fragments. | Fragmentation: Restriction enzymes act as molecular scissors to cut DNA into manageable pieces of varying sizes. |
| Resolution: Gel electrophoresis separates fragments, but it creates a “smear” where individual genes remain invisible. | Specific Detection: By transferring fragments to a membrane and using a “probe,” we illuminate only the sequence of interest. |
| Fragility: Agarose gels are watery, fragile, and difficult to handle for complex chemical reactions. | Immobilization: Transferring the DNA to a durable membrane creates a stable, semi-permanent replica of the gel’s pattern. |

For a scientist, this process is the key to:
• Visualizing Gene Rearrangement: Observing how genes physically shift or change, such as the rearrangements essential for immune system function.
• Determining Copy Number: Quantifying exactly how many times a specific gene appears in a genome, which is vital for understanding certain diseases.
• Genetic Fingerprinting: Identifying unique patterns that define an individual or diagnose genetic conditions with unmatched precision.
2. The Scientific Genesis and Evolutionary Impact
The emergence of Southern blotting revolutionized genetic research by providing the first viable means to “see” and locate specific genes within the vast expanse of a genome. Before its advent, identifying single sequences in complex mixtures required laborious processes such as slicing gels and eluting DNA manually, which significantly compromised resolution.

Edwin Southern’s seminal 1975 publication introduced a streamlined workflow that coupled high-resolution separation with permanent immobilization on a replica membrane. This invention sparked a “compass direction” naming convention in molecular biology; subsequent methods for RNA were dubbed “Northern” and those for proteins “Western,” establishing a lasting nomenclature.
This technique transformed the competitive landscape of genomics by enabling innovations such as Restriction Fragment Length Polymorphism (RFLP) mapping and DNA fingerprinting. These breakthroughs allowed for the first genetic linkage maps and the prenatal diagnosis of genetic disease, bridging the gap between raw biochemical samples and actionable clinical data. By providing a semi-permanent record of the genome, Southern blotting shifted the scientific focus toward the analysis of gene rearrangements and somatic variations.

3. Pre-Blotting Preparation: DNA Digestion and Gel Electrophoresis
Precise DNA fragmentation and separation are critical prerequisites for a successful blot. Without distinct separation of fragments by molecular weight, the resulting hybridization signals would lack the resolution required to identify targeted sequences.
• DNA Isolation and Digestion: Successful genomic analysis typically requires 10 µg of high-quality genomic DNA. This DNA is digested to completion using restriction endonucleases such as EcoRI or HaeIII. To ensure complete digestion without interference, the volume of the restriction enzyme should be less than 10% of the total reaction volume, as the glycerol in enzyme stocks can inhibit the reaction at higher concentrations.

• Agarose Gel Electrophoresis: Fragments are separated by size via agarose gel electrophoresis. Strategic selection of agarose concentration is vital: lower concentrations (0.3%) resolve large fragments up to 60 kb, while higher concentrations (2.0%) are used for smaller fragments. Note that fragments of 500 bp or less generally give low yields of hybrid and may be under-represented in the final analysis.

Preparation Mechanics
| Process | Chemical/Physical Agent | Functional Outcome for the Learner |
|---|---|---|
| Restriction Digestion | Restriction Endonucleases | Cuts DNA at specific recognition sites, turning a massive genome into a collection of smaller fragments. |
| Gel Electrophoresis | Electric Current & Agarose Matrix | Separates fragments by size; smaller fragments navigate the “sieve” faster than larger ones. |
| Depurination | 0.25 M Hydrochloric Acid (HCl) | Partially breaks down very large fragments (>5kb or >15kb) into smaller lengths to improve transfer speed. |
4. The Mechanics of Transfer: Denaturation and Membrane Immobilization
The transfer process moves DNA from the fragile agarose gel to a durable solid support, creating a single-stranded replica. This transition requires the DNA to be denatured into single strands, typically by soaking the gel in an alkaline solution.

The Chemical Unzipping: Why DNA Must Be Denatured
DNA is naturally double-stranded (dsDNA). In this state, the genetic information is tucked inside the helix, protected by hydrogen bonds and unavailable for binding with a probe.
To “open” the DNA, the gel is soaked in an alkaline denaturation solution (typically NaOH). This chemical treatment breaks the hydrogen bonds, turning the dsDNA into single-stranded DNA (ssDNA). However, there is a critical second step: Neutralization. After the NaOH bath, the gel is soaked in Tris-HCl. This brings the pH back down to a neutral range (approx. 7.0–9.0).
The Critical Goal: Probes can only bind to “unpaired” bases. Denaturation ensures the target DNA is ready for hybridization. The pH Trap: If you skip neutralization, the membrane—especially nitrocellulose—will fail to “catch” the DNA. At a pH higher than 9.0, the DNA will simply flow through the membrane without binding, ruining the blot.
With the DNA now “unzipped” and neutralized, we must move it out of the gel and onto a more durable surface.
Technical Comparison of Transfer Methods
• Upward vs. Downward Capillary Transfer: Traditional upward transfer uses a buffer reservoir and a stack of paper towels to draw DNA through the gel.
Upward Capillary Transfer (The Standard): This traditional setup utilizes a weighted stack (exactly 0.2–0.4 kg) to draw high-salt buffer through the gel. While reliable, the primary architectural risk is the compression of the agarose matrix. This “crushing” retards the diffusion of high-molecular-weight fragments and often necessitates 18-hour durations for fragments >15 kb.
The Capillary Pump: Physics of the Transfer
The transfer process, or “blotting,” relies on capillary action. Think of the system as a biological pump where the flow of liquid carries the DNA along with it.
A high-salt buffer (20x SSC) moves from a reservoir, through the gel, and up into a thick stack of dry paper towels. As the buffer passes through the gel, it physically carries the denatured ssDNA out of the agarose matrix. When the DNA hits the membrane, it becomes trapped, while the buffer continues upward.
The Transfer Stack (Bottom to Top):
1. Buffer Reservoir: Contains the 20x SSC “fuel” for the pump.
2. Filter Paper Wick: Draws buffer from the reservoir up to the gel.
3. Agarose Gel: Positioned containing the sorted DNA fragments.
4. Plastic Wrap/Foil Border: Essential Seal. This prevents “short-circuiting” where the buffer flows around the edges of the gel instead of through it.
5. Membrane: The destination surface (Nylon or Nitrocellulose) where DNA is captured.
6. Filter Paper/Paper Towels: The “sink” that pulls the buffer upward through the system.
7. Weight: Ensures even, tight contact between all layers to prevent air bubbles.
Once the DNA is trapped on the membrane, it must be permanently “locked” in place before the search begins.
Downward Capillary Transfer (The Rapid Alternative): This configuration utilizes gravity to maintain constant kinetics, preventing the “pressure-soaking” feedback loop that occurs in upward systems when paper towels become saturated. By eliminating heavy weights, it preserves the matrix pores, allowing complete transfer from a 1% agarose gel in approximately 1 hour without compromising completeness.
• Alkaline vs. Neutral Transfer: Alkaline transfer (utilizing 0.4 M NaOH) is highly efficient for positively charged nylon membranes, as it promotes irreversible covalent binding without a post-transfer fixative step. Neutral transfer using high-salt buffers (SSC) remains the standard for nitrocellulose, as these membranes are unstable at a pH above 9.0.
Comparison of Transfer Methodologies
| Transfer Direction | Typical Duration | Buffer Requirements | Primary Strategic Risk |
|---|---|---|---|
| Upward | 2 hrs (1-kb) – 18+ hrs (15-kb) | High-Ionic Strength (10x–20x SSC) | Lateral diffusion and resolution loss due to gel crushing. |
| Downward | 1–3 Hours | Flexible (SSC or NaOH) | Requires precise stack assembly to prevent evaporation. |
| Alkaline | 2–16 Hours | 0.4 M NaOH | Membrane degradation; not compatible with nitrocellulose. |
Membrane Chemistry: Nitrocellulose vs. Nylon Substrates
The choice of chemical substrate represents a trade-off between signal-to-noise ratios and the requirements for physical durability.
• Nitrocellulose: Historically utilized for its exceptionally low background signal, nitrocellulose requires high-salt (20x SSC) environments for non-covalent hydrophobic attachment. However, it is physically fragile and limited to approximately three rounds of hybridization before the signal is lost. Critically, we define the 500-nucleotide threshold as the failure point for nitrocellulose; fragments below this size are under-represented or lost.
• Nylon (Uncharged and Positively Charged): Offering superior tensile strength and a binding capacity of 400–600 µg/cm² (five times that of nitrocellulose), nylon supports covalent attachment via UV crosslinking or alkaline binding. It retains fragments as small as 50 bp, making it superior for mapping small targets. However, a significant consultant’s warning applies: nylon is prone to high background noise when paired with certain nonradioactive DNA probes.
Membrane Selection Criteria
1. Reprobing Requirements: For longitudinal studies requiring the stripping of a blot 10 or more times, Nylon is the only viable substrate.
2. Fragment Size Limits: If the mapping target is <500 nt, Nylon is mandatory to prevent fragment leaching.
3. Detection System Compatibility: For high-sensitivity radioactive detection, Nitrocellulose is preferred for its superior signal-to-noise ratio.
4. Binding Mechanism: If immediate immobilization is required without a secondary baking/UV step, Positively Charged Nylon under alkaline conditions is the standard.
| Feature | Nitrocellulose | Supported Nitrocellulose | Uncharged Nylon | Positively Charged Nylon |
|---|---|---|---|---|
| Binding Capacity | 80–100 µg/cm² | 80–100 µg/cm² | 400–600 µg/cm² | 400–600 µg/cm² |
| Tensile Strength | Poor (Fragile) | Good | Good (Robust) | Good (Robust) |
| Lower Size Limit | ~500 nt | ~500 nt | 50 nt or bp | 50 nt or bp |
| Reprobing Suitability | Poor (<3 times) | Poor (Signal loss) | Excellent (10+ times) | Excellent (10+ times) |
| Attachment Mode | Noncovalent (Baking) | Noncovalent (Baking) | Covalent (UV) | Covalent (Alkaline/UV) |
Quality and Safety Directive For high-throughput genomic facilities, standard nitrocellulose is a liability due to its extreme fragility and tendency to lose signal during stripping. While it provides low background, nylon’s “covalent crosslinking” capability makes it the superior choice for multi-probe studies.
Safety Warning: If utilizing nitrocellulose, the membrane must be baked at 80°C under vacuum; failing to use a vacuum environment may lead to the spontaneous ignition of the nitrocellulose.
Pro-Tip: Enhancing Transfer Efficiency For genomic samples containing DNA fragments larger than 15 kb, the gel should be treated with dilute HCl for approximately 30 minutes. This induces partial depurination, leading to strand cleavage. The resulting length reduction significantly improves the transfer of these larger molecules from the gel matrix to the membrane support.
Technical Nuances: Dictating Sensitivity in Genomic Mapping
Optimization is not universal; technical interventions must be tailored to the target DNA’s physical properties.
• DNA Fragment Size and Depurination: Fragments >5 kb or >20 kb exhibit retarded kinetics. To facilitate transfer, researchers must employ HCl-mediated depurination. The physical indicator for adequate treatment is the colorimetric shift of xylene cyanol to green and bromophenol blue to yellow; once this occurs, an additional 10 minutes of acid treatment is required for optimal cleavage.
• Matrix Dynamics: Gel thickness >7 mm or agarose concentrations >1% significantly increase the “cost” of the experiment—not just in time, but in resolution loss. Long transfer periods in dense matrices lead to lateral diffusion; thus, downward transfer is the recommended architectural countermeasure.
• Ionic Strength: High ionic strength (10x–20x SSC) is an absolute requirement for nitrocellulose retention. Lower concentrations (10x) often lead to the loss of small DNA fragments during the immobilization phase.
Immobilization: To ensure the DNA remains attached during hybridization, specific fixation is required. Nylon membranes are immobilized via UV cross-linking at 302 nm for 2–3 minutes. Nitrocellulose membranes must be baked at 80°C for 2 hours in a vacuum oven; the vacuum is a critical safety requirement to prevent the flammable nitrocellulose from igniting.
| Membrane Type | Fixation Method | Scientific Principle |
|---|---|---|
| Nylon | UV Crosslinking (254-nm or 302-nm) | Uses UV light to create covalent bonds. Wavelength choice depends on the specific crosslinker and manufacturer calibration. |
| Nitrocellulose | Baking (80°C for 2 hours) | Creates non-covalent hydrophobic attachments. Requires high salt (20x SSC) during transfer to facilitate binding. |
5. Hybridization and Detection Strategies
Hybridization is the analytical core of the assay, where the biochemical tension between salt concentration and temperature determines the sensitivity and specificity of the result.
• Labeling Options:
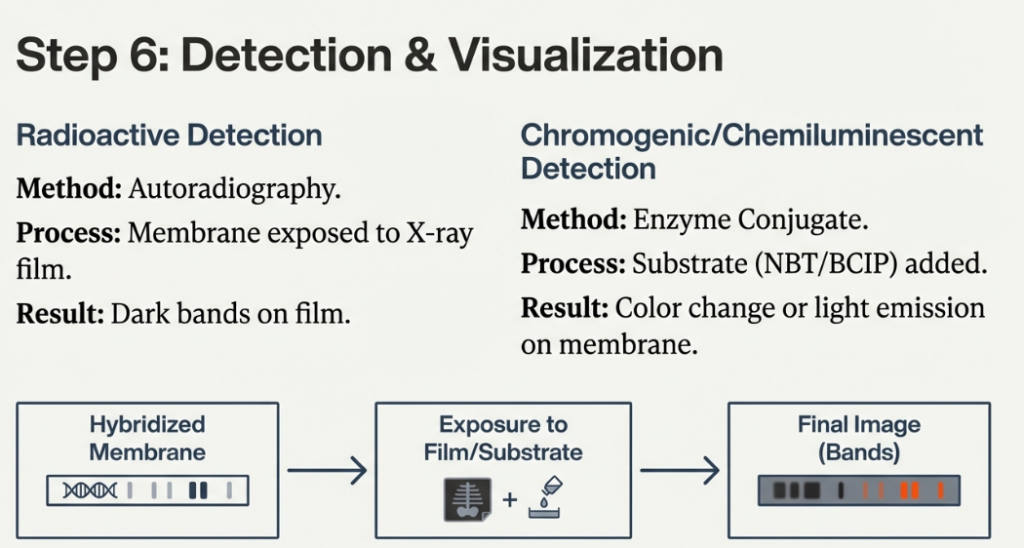
◦ Radioactive Labeling: Probes are often labeled with [a-32P]-dCTP and detected via autoradiography on X-ray film.
◦ Non-Radioactive Labeling: Probes are labeled with Digoxigenin-11-dUTP. Visualization involves an alkaline phosphatase-conjugated antibody that recognizes the digoxigenin on the probe. This complex then triggers a colorimetric reaction with NBT/BCIP to produce visible bands.

Checklist for a Successful Probe:
• Linear & Denatured: The probe must be single-stranded to allow base pairing.
• Labeled: Must contain a detectable tag (Radioactive [α-32P] or Non-radioactive Digoxigenin/DIG).
• Stringency Control: Stringency is managed by adjusting temperature and salt concentration (SSC). High stringency (high temperature, low salt) destabilizes the hydrogen bonds of mismatched hybrids more than those of perfectly matched ones, ensuring that only specific sequences remain bound while reducing background noise.
◦ High heat creates more thermal vibration, shaking off any probes that aren’t a perfect match.
◦ Low salt reduces ionic shielding, making it harder for the probe to stay stuck unless the anchor is 100% correct.

The final visualization allows researchers to see the “needle” they found in the haystack.
• Radioactive Probes: The membrane is exposed to X-ray film (Autoradiography), creating dark images where the probe bound.
• Non-radioactive (DIG) Probes: An antibody recognizes the DIG tag and triggers an enzyme to create a colorimetric or chemiluminescent signal.
Interpreting the Results
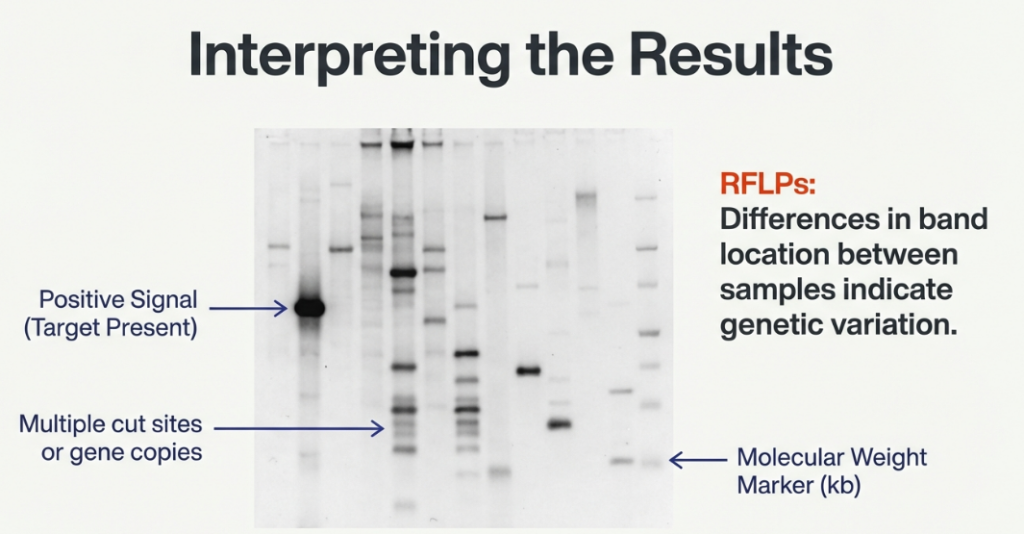
The bands you see are the physical proof of your target sequence:
• A single band indicates the probe found one specific fragment size.
• Multiple bands often indicate Restriction Fragment Length Polymorphisms (RFLPs). This happens when point mutations create or destroy restriction sites, or when a gene has been duplicated in the genome.
6. Strategic Applications and Technical Limitations
Southern blotting remains the “gold standard” for structural genomic analysis, providing clarity in areas where short-read sequencing lacks context.
Professional Applications
1. Genetic Fingerprinting: Personal identification and forensic analysis through hypervariable minisatellite detection.
2. Somatic Rearrangements: Detecting rearrangements in T-cell receptors and immunoglobulin genes.
3. Transgene Analysis: Determining copy numbers and verifying that no gross rearrangements occurred during cloning.
4. Methylation Mapping: Utilizing MspI and HpaII to identify methylated cytosine sites. HpaII is inhibited by methylation while MspI is not; comparing the two digests allows for the identification of specific methylated sites.

Technical Limitations
The method is labor-intensive, requiring 1–5 days (typically 24 hours for digestion/electrophoresis and 16–24 hours for transfer). It requires a high quantity of DNA (10 µg) and cannot detect mutations at the base-pair level unless the mutation alters a restriction site.

3 Factors for Success
1. Signal Intensity: Dark, clear bands indicate successful hybridization and high-yield transfer.
2. Low Background: A clean membrane indicates that stringency was high enough to wash away non-specific “noise.”
3. Size Determination: The sharp bands seen in the result represent the exact size-fractionated fragments sorted during the very first electrophoresis step. By comparing these bands to the original markers, we close the loop and identify the gene.
Protocol Calibration List
• Intervene with 0.25 M HCl: Mandatory if the target fragments are >5 kb. Monitor dye colors (green/yellow) to ensure successful depurination.
• Adjust Transfer Duration: If utilizing a >1% agarose gel or an upward transfer for large fragments, extend the duration to 24 hours to ensure quantitative transfer.
• Alkaline Shift: Transition to 0.4 M NaOH only when using alkali-resistant, positively charged nylon to bypass UV crosslinking and baking.
Methodology Selection Guide
• High-Sensitivity Mapping of Small Fragments (<500 bp):
◦ Recommendation: Nylon Membrane + Alkaline Transfer + UV Crosslinking (if uncharged).
◦ Verdict: This maximizes binding capacity and ensures the retention of small fragments that would fail to bind to nitrocellulose.
• Rapid Processing for Large Fragments (>10 kb):
◦ Recommendation: HCl Depurination + Downward Capillary Transfer.
◦ Verdict: This mitigates the “pressure-soaking” effect and utilizes cleaving to bypass matrix retardation, achieving completion in ~1 hour.
• Low-Background Hybridization (Radioactive Probes):
◦ Recommendation: Nitrocellulose + High-Salt Upward Transfer (20x SSC).
◦ Verdict: This provides the cleanest signal-to-noise ratio for isotopic detection, provided reprobing needs are limited to <3 rounds.
6. Summary of Troubleshooting and Quality Control
The final quality of the genomic map is dictated by the precision of the immobilization phase. Early warning signs of suboptimal transfer must be identified prior to hybridization:
• Yellow Patches: On nitrocellulose, this indicates inadequate neutralization (pH >9.0), which prevents DNA binding.
• Residual Ethidium Bromide: Post-transfer gels should be inspected under UV; significant residual fluorescence indicates an incomplete transfer due to gel crushing or insufficient duration.
• Membrane Discoloration: Discolored or dusty membranes introduce artifacts. A successful transfer produces a pure white, semi-permanent reproduction of the gel’s banding pattern.
Verification of Transfer Efficiency
Verification ensures that the membrane is a replica of the gel before proceeding to costly hybridization.
1. Restaining: Restain the discarded gel with Ethidium Bromide post-transfer. The near-total absence of DNA—particularly in high-molecular-weight regions—is the required benchmark.
2. Physical Markers: Use a pencil to mark well positions directly on the membrane. For nylon, slits can be cut with a razor blade for permanent marking.
3. Orientation: Document an asymmetric cut at one corner of the membrane in the laboratory notebook to prevent orientation errors during multi-day autoradiography.
Failures in Southern blotting are typically holistic; a suboptimal setup in the pre-analytical phase cannot be corrected during detection.
| Problem | Cause | Solution |
|---|---|---|
| Faint Signal | Insufficient DNA; Short transfer time. | Increase DNA loading; Extend transfer to 16h if using upward method. |
| High Background | Membrane dried during wash; Glove powder. | Ensure constant hydration; Use powder-free gloves exclusively. |
| Yellow Patches | Inadequate neutralization (Nitrocellulose). | Extend neutralization wash; Ensure pH <9.0 before transfer. |
| No Bands | DNA degradation; UV bulb failure. | Restain gel post-transfer; Verify UV transilluminator output. |
Southern blotting remains an essential diagnostic for high-precision genomic architecture. By optimizing the energy-balance between transfer kinetics and membrane chemistry, researchers can achieve a level of structural insight and quantitative reliability that remains unreachable by alternative methodologies.
7. Conclusion: The Enduring Legacy of the Southern Blot
The Southern blot’s legacy is defined by its elegant integration of DNA immobilization, molecular hybridization, and high-resolution detection. By creating a semi-permanent replica of genomic patterns, it enabled the first genetic linkage maps and revolutionized molecular diagnostics. Mastering these foundational principles remains essential for the high-fidelity analysis of complex genomic structures in modern molecular research.
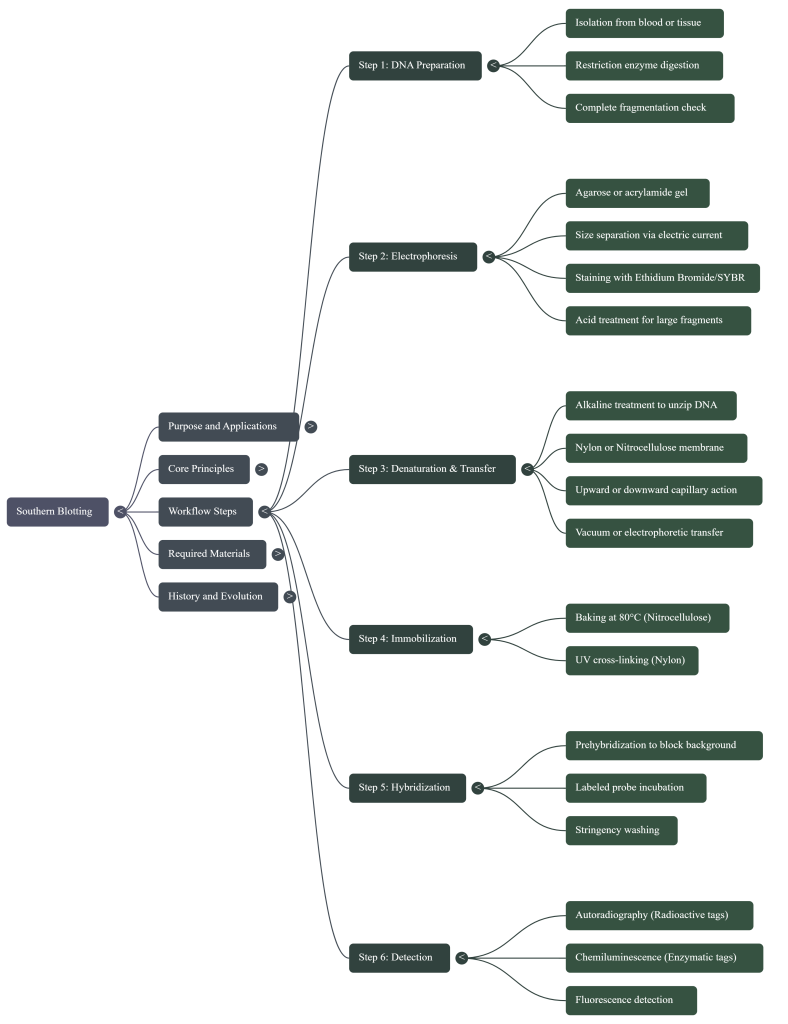
Learning Synthesis: The 5-Step Journey
1. Cut: Use “molecular scissors” to digest the genomic DNA.
2. Sort: Use electrophoresis to separate fragments by size.
3. Copy: Use capillary action to move DNA to a durable membrane.
4. Find: Use a labeled probe to hybridize with the target sequence.
5. See: Use autoradiography or colorimetric detection to reveal the bands.
Image Summary


Questions/Answers
1. What types of labels can be used for probes?
In Southern blotting, probes can be labeled using a wide variety of radioactive and nonradioactive systems. The choice of label depends on factors such as required sensitivity, ease of use, quantification needs, and available experimental time.
Radioactive Labels
Historically, radioactive isotopes were the original standard for labeling probes. Common isotopes used include:
• Phosphorus-32 (32P): Often used in the form of [α-32P]-dCTP.
• Hydrogen-3 (3H): Used for both DNA and RNA probes.
• Sulfur-35 (35S): Commonly used for detecting labeled RNAs.
• Iodine-125 (125I): Utilized for radioactive detection.
• Carbon-14 (14C): Mentioned as a label detectable by fluorography.
Radioactive probes are typically visualized using autoradiography (exposure to X-ray film) or phosphorimaging instruments.
Nonradioactive Labels
A variety of nonradioactive techniques have been developed to avoid the hazards and disposal requirements of radioactive materials. These include:
• Fluorescent Labels: Probes can be tagged with fluorescent dyes, such as Alexa Fluor (e.g., Alexa Fluor 488, 546, or 647), which allow visualization under specific wavelengths of light.
• Enzymatic and Chemiluminescent Labels: These probes are tagged with an enzyme (like alkaline phosphatase) that generates a chemiluminescent signal when incubated with a specific substrate (such as CDP-Star).
• Chemical Affinity Tags:
◦ Digoxigenin (DIG): Probes are often labeled with Digoxigenin-11-dUTP. These are detected using an antibody conjugated to an enzyme (like alkaline phosphatase) that recognizes the digoxigenin.
◦ Biotin: Probes can be biotinylated and subsequently detected using streptavidin or antibodies linked to enzymes.
• Chromogenic/Chemical Tags: These probes use tags that produce a visible colorimetric assay or color development directly on the membrane (such as using NBT/BCIP as a substrate).
According to the sources, while radioactive probes were the original method, nylon membranes are particularly well-suited for nonradioactive systems because they can be reprobed multiple times and provide high binding capacity, though they may sometimes result in higher background noise compared to nitrocellulose.
2. How do radioactive and nonradioactive detection methods compare in sensitivity?
Based on the sources, the sensitivity of radioactive and nonradioactive detection methods in Southern blotting is comparable, though advancements in nonradioactive technology have allowed it to match or even exceed traditional radioactive standards in certain applications.
The comparison in sensitivity is characterized by the following factors:
1. Historical and Theoretical Sensitivity
• Radioactive Sensitivity (32P): Historically, probes labeled with 32P (phosphorus-32) were the standard for high-sensitivity detection. This method is highly sensitive; for example, approximately 100 c.p.m. (counts per minute) of 32P in a single 1-cm wide band can be detected with an overnight exposure on X-ray film.
• Comparison of Isotopes: Within radioactive methods, different isotopes vary in sensitivity. 32P is significantly more sensitive than 3H (tritium); while 32P requires only 100 c.p.m. for a visible band overnight, 3H requires approximately 3000 d.p.m. (disintegrations per minute) in a 1-cm band for a similar result.
• Nonradioactive Advancements: While nonradioactive methods were developed later, research has indicated that by reducing background noise, nonradioactive Northern and Southern blot analyses can achieve higher sensitivity than 32P-based hybridizations.
2. Factors Enhancing Nonradioactive Sensitivity
Modern nonradioactive systems utilize specific reagents to push detection limits:
• Ultrasensitive Buffers: Specialized hybridization buffers (such as ULTRAhyb) can increase sensitivity up to 100 times compared to standard solutions by driving hybridization to completion without increasing background. These systems can detect as few as 10,000 target molecules.
• Chemiluminescent Substrates: Nonradioactive systems often use chemiluminescent substrates like CDP-Star, which are described as being among the “brightest and longest-lived,” providing maximum sensitivity and allowing for multiple exposures over a two-day period.
• Colorimetric Detection: Some nonradioactive probes (like digoxigenin) use enzymatic reactions (e.g., NBT/BCIP) that allow researchers to monitor color development periodically until the desired signal strength is reached.
3. Detection Requirements for Single-Copy Genes
Both methods are sensitive enough to detect single-copy sequences in complex genomes, provided enough DNA is loaded:
• DNA Loading: For mammalian genomic DNA, researchers typically load approximately 10 µg of DNA per slot to ensure a signal is generated when using standard-length probes and high-specific-activity labels.
• Visualization Limits: The choice of label often depends on the “sensitivity needed,” but both radioactive (via autoradiography/phosphorimaging) and nonradioactive (via chemiluminescence or fluorescence) methods are capable of identifying low-abundance target sequences.
Summary of Comparison
| Feature | Radioactive Detection (32P) | Nonradioactive Detection |
|---|---|---|
| Traditional Rank | The original gold standard for sensitivity. | Historically considered less sensitive, now comparable. |
| Detection Limit | ~100 c.p.m. per 1-cm band (overnight). | As few as 10,000 target molecules. |
| Sensitivity Drivers | High specific activity (>109 cpm/µg). | Background reduction and ultrasensitive buffers. |
| Quantitation | Highly accurate via densitometry/phosphorimaging. | Visualized via chemiluminescence or colorimetric assays. |
3. What are the safety differences between probe types?
The safety differences between probe types in Southern blotting primarily center on the management of ionizing radiation versus chemical hazards. According to the sources, the use of radioactive probes requires a specialized safety infrastructure and regulatory oversight that nonradioactive systems are designed to avoid.
Radioactive Probe Safety
Probes labeled with isotopes such as 32P, 3H, or 35S present unique physical hazards that require rigorous safety protocols:
• Regulatory Oversight: Researchers must consult an institutional Radiation Safety Officer for the proper ordering, handling, and disposal of all radioactive materials.
• Physical Shielding: Handling radioactive isotopes like 32P requires working behind Plexiglass shields to protect personnel from radiation exposure.
• Specialized Waste Management: All radioactive waste, including used hybridization solutions and contaminated materials, must be disposed of through dedicated radioactive waste streams.
• Monitoring: The use of radioactive materials typically requires monitoring background levels with a radiation detector to ensure no contamination has occurred during the process.
Nonradioactive Probe Safety
Nonradioactive labeling and detection techniques (such as those using digoxigenin, biotin, or fluorescent tags) were developed in part to eliminate the hazards associated with radioactivity.
• Hazard Mitigation: These probes do not emit ionizing radiation, removing the need for Plexiglass shielding or radiation safety officers.
• Chemical Hazards: While they avoid radiation, nonradioactive systems still involve hazardous chemicals. For example, formamide, a common component in hybridization buffers, is classified as hazardous waste and must be disposed of accordingly.
• Disposal Flexibility: If no radioactive materials are used, waste from the procedure is treated as standard hazardous chemical waste rather than radioactive waste.
General Laboratory Safety (Both Probe Types)
Regardless of the probe type chosen, the Southern blot procedure involves other safety risks identified in the sources:
• Mutagenic Reagents: Ethidium bromide, frequently used to stain DNA in the agarose gel, is mutagenic and requires careful handling with gloves and specialized disposal.
• UV Exposure: The immobilization step often involves UV cross-linking, which is harmful to the eyes and skin; researchers must wear suitable eye protection and avoid bare skin exposure when the UV source is active.
• Corrosive Solutions: The protocol utilizes strong acids (0.25 M HCl) and alkalis (0.4 N NaOH) for depurination and denaturation, requiring the constant use of gloves to protect the skin.
4. Can multiple probes be used on one blot?
Yes, multiple probes can be used to analyze a single Southern blot, though this is typically achieved through specialized transfer techniques, physical division of the membrane, or sequential “reprobing.”
According to the sources, there are three primary ways to utilize different probes for the same DNA samples:
1. Reprobing (Sequential Hybridization)
The most common way to use multiple probes on one blot is to perform reprobing, where a membrane is hybridized with one probe, visualized, and then “stripped” of that probe so it can be hybridized with a new one.
• Membrane Choice: The durability of the membrane is critical for this method. Nylon membranes are robust and can be reprobed ten to twelve times before they begin to fall apart.
• Nitrocellulose Limitations: In contrast, nitrocellulose membranes are fragile and rarely survive more than three rounds of hybridization.
• Process: After the first signal is recorded, the membrane is treated to remove the original probe (stripping) before the next labeled probe is applied.
2. Bi-directional Transfer
Researchers can analyze the same set of restriction fragments with two different probes simultaneously by using bi-directional transfer.
• In this procedure, DNA is transferred from both the top and bottom surfaces of a single agarose gel onto two separate membranes at once.
• This creates two identical replicas of the DNA banding pattern, allowing each membrane to be hybridized with a different probe immediately.
• Limitation: This method is best for high-concentration target sequences (like cloned DNA) because the efficiency of transfer is lower as fluid is withdrawn from both sides of the gel.
3. Physical Division of the Membrane
If the target sequences are known to be located in different areas or if the researcher wants to test different probes on the same sample, the membrane can be physically divided.
• Longitudinal Cutting: A single membrane strip containing transferred DNA can be cut longitudinally into two or more parts.
• For example, one source describes a study where a single strip was cut in half; the left side was hybridized to 18 S RNA while the right side was hybridized to 28 S RNA.
Visualizing Multiple Probe Results
The sources provide examples of successful multi-probe analysis. For instance, an autoradiograph of a Southern blot is shown, where six different panels were each hybridized with a different probe to identify specific gene families. This allows for a comprehensive comparison of different genetic sequences within the same experimental framework.
5. How does probe-specific activity affect detection?
In the Southern blot procedure, the specific activity of a probe—the amount of radioactivity or label per unit mass of the probe—is a critical factor that directly determines the sensitivity and speed of detection.
According to the sources, probe-specific activity affects detection in the following ways:
1. Detection of Low-Abundance Sequences
High specific activity is essential for identifying sequences that are present in very low concentrations, such as single-copy genes in complex mammalian genomes. For standard Southern analysis of mammalian genomic DNA, researchers typically load approximately 10 µg of DNA into the gel and must use probes with a high specific activity (typically >109 cpm/µg) to successfully detect these single-copy sequences.
2. Quantitative Detection Limits
The specific activity dictates the absolute limit of what the procedure can visualize. A radioactive probe with a specific activity between 108 and 109 dpm/µg (disintegrations per minute per microgram) has a detection limit of approximately 0.5 pg of DNA. If the specific activity is lower, the probe may fail to hybridize with enough labeled molecules to produce a discernable signal above the background noise.
3. Impact on Exposure Time
The time required to visualize results is inversely related to the probe’s specific activity.
• High Specific Activity (32P): A single band 1 cm wide containing approximately 100 c.p.m. of 32P can be detected with an overnight exposure on X-ray film.
• Lower Specific Activity (3H): Isotopes with lower specific activity or lower emission energy require much longer periods. For example, 3H (tritium) requires about 3000 d.p.m. in a 1-cm band to provide a visible exposure overnight. In some historical experiments, fluorographs of 3H-labeled hybrids required exposure times as long as two months.
4. Signal Intensity and Interpretation
The intensity of the hybridization signal on an autoradiograph or digital scan is a product of both the amount of target DNA and the specific activity of the probe. Higher specific activity results in more intense bands, which facilitates more accurate quantitation and interpretation of results, such as determining gene copy numbers or identifying related sequences in different species.
5. Balancing Specific Activity and Stability
While high specific activity improves detection, the sources note that it must be managed carefully. For instance, radiolabeled markers (like those with 35S or 33P) are sometimes not recommended for size estimation because they may require exposure times that differ significantly from those optimized for the target bands of the high-activity probe. Furthermore, for nonradioactive probes, the yield of the label (and thus its effective specific activity) can often be increased by extending incubation times during the labeling reaction.
References
Southern, E. M. (1975). Detection of specific sequences among DNA fragments separated by gel electrophoresis. J mol biol, 98(3), 503-517. https://doi.org/10.1016/S0022-2836(75)80083-0
Southern, E. Southern blotting. Nat Protoc 1, 518–525 (2006). https://doi.org/10.1038/nprot.2006.73
Brown T. Southern blotting. Curr Protoc Immunol. 2001 May;Chapter 10:Unit 10.6A. doi: 10.1002/0471142735.im1006as06. PMID: 18432697.
Tofano D, Wiechers IR, Cook-Deegan R. Edwin Southern, DNA blotting, and microarray technology: A case study of the shifting role of patents in academic molecular biology. Genom Soc Policy. 2006 Aug 15;2(2):50. doi: 10.1186/1746-5354-2-2-50. PMCID: PMC5424904.
Glenn, G., & Andreou, L. V. (2013). Analysis of DNA by Southern blotting. In Methods in enzymology (Vol. 529, pp. 47-63). Academic Press. https://doi.org/10.1016/B978-0-12-418687-3.00005-7
Green, M. R., & Sambrook, J. (2021). Analysis of DNA by Southern blotting. Cold Spring Harbor Protocols, 2021(7), pdb-top100396.
https://en.wikipedia.org/wiki/Southern_blot
https://www.thermofisher.com/np/en/home/life-science/dna-rna-purification-analysis/nucleic-acid-gel-electrophoresis/southern-blotting.html
https://www.genome.gov/genetics-glossary/Southern-Blot
Related posts:
 Comprehensive Guide to DNA Library Types and High-Throughput Cloning Methodologies
 The Secret of the Blue and White Colonies: An Introduction to Blue-White Screening
 Molecular Scissors: An Introduction to Restriction Enzymes
 Artificial Chromosomes: YACs, BACs, MACs, HACs
 Understanding the Types of Cloning: A Comprehensive Guide for Beginners


Pingback: The Ultimate Guide to Northern Blotting: Principles, Protocols, and Enhanced Detection Techniques - Aneknowledge.com
Pingback: The Western Blot: A Beginner’s Guide to the Art of Protein Discovery - Aneknowledge.com