1. Executive Introduction
Genotyping-by-Sequencing (GBS) has redefined the parameters of agricultural genomics by providing a high-throughput, cost-effective alternative to whole-genome approaches. As a premier “reduced-representation sequencing” method, GBS enables the rapid discovery of thousands of single-nucleotide polymorphisms (SNPs) across diverse populations, bypassing the prohibitive costs of deep whole-genome resequencing (WGR). By leveraging the massive parallel capacity of next-generation sequencing (NGS), GBS provides the high-density marker resolution necessary for modern molecular breeding and complex trait dissection. This strategic transition from traditional markers to sequence-based genotyping is underpinned by a meticulous technical methodology that converts genomic complexity into actionable bioinformatics.
The Strategic Shift to Genotyping-by-Sequencing (GBS)
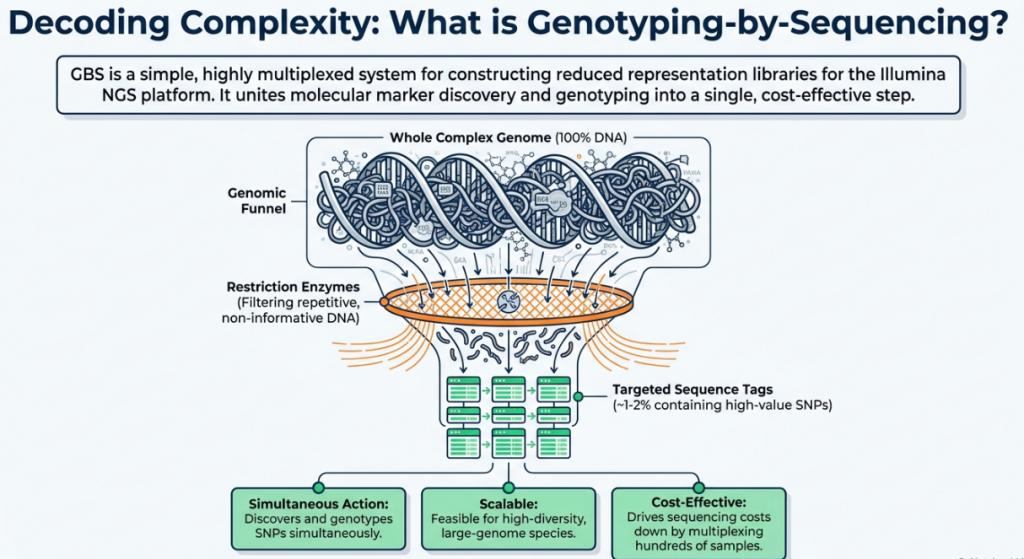
The landscape of plant genomics has transitioned from the rudimentary resolution of traditional molecular markers, such as Restriction Fragment Length Polymorphisms (RFLPs) and Simple Sequence Repeats (SSRs), to the high-density interrogation of Single Nucleotide Polymorphisms (SNPs). In modern molecular breeding, GBS selectively interrogates the genome, strategically bypassing highly repetitive, non-informative heterochromatin to maximize the return on sequencing investment. As a reduced-representation sequencing (RRS) approach, GBS serves as a high-throughput, cost-effective alternative to Whole-Genome Resequencing (WGR). By utilizing restriction enzymes to reduce genome complexity, it allows for the discovery of thousands of SNPs across large populations without the prohibitive computational and financial costs associated with sequencing non-coding, repetitive base pairs.
Comparative Advantage of GBS in Molecular Breeding:
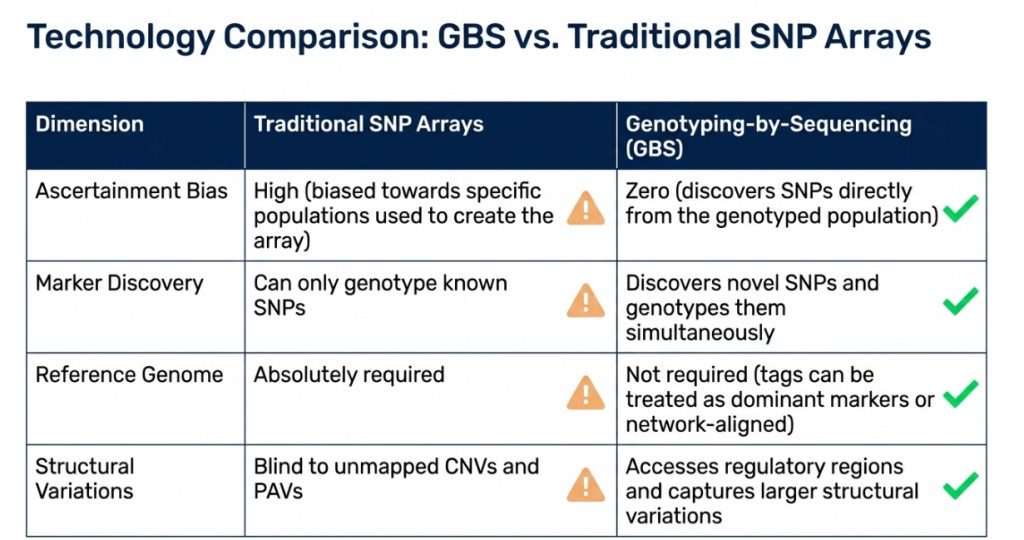
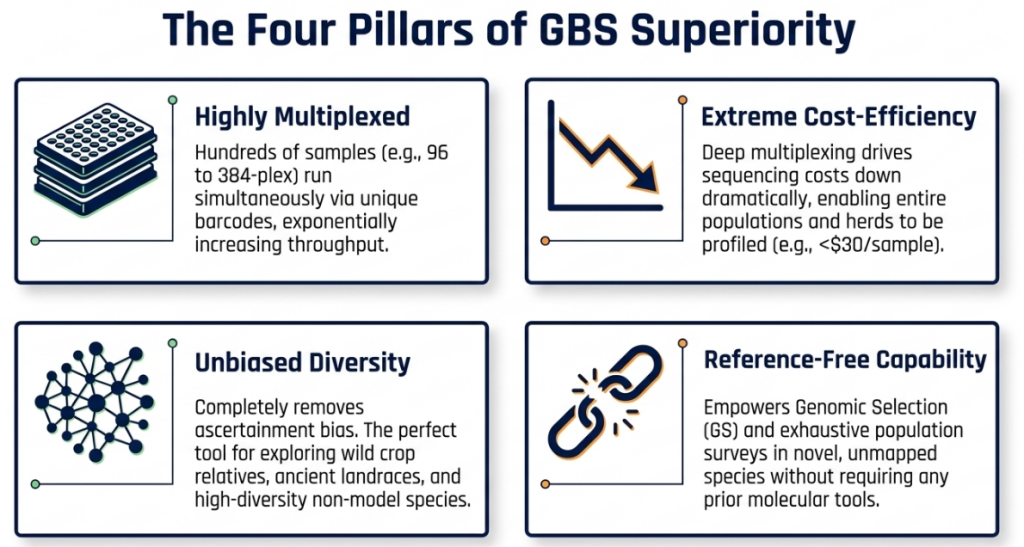
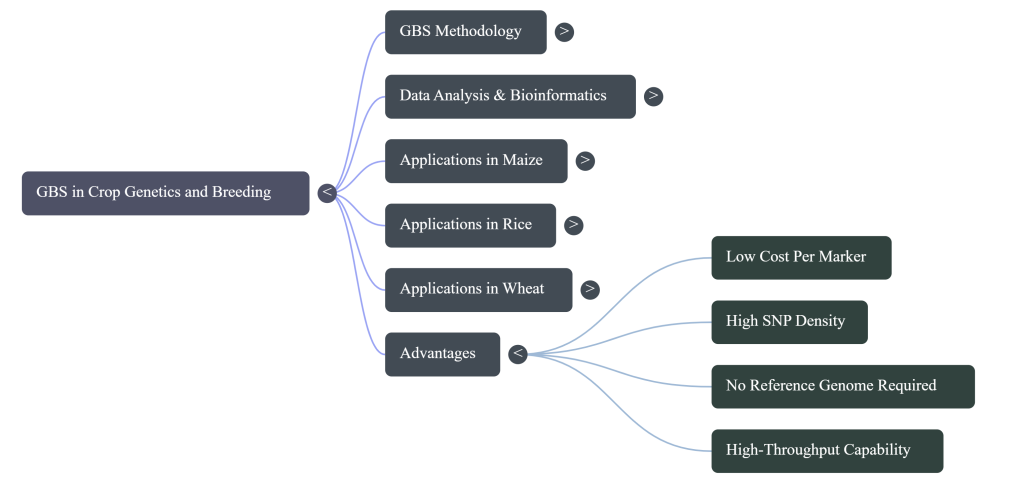
- Cost-Efficiency: Dramatically lower cost per data point compared to array-based platforms or WGR, facilitating large-scale population studies.
- Strategic Complexity Reduction: Simplifies the analysis of large, polyploid, or repetitive genomes (like maize and wheat) by targeting specific restriction sites in low-copy regions.
- High-Plex Multiplexing: Enables simultaneous sequencing of hundreds of individuals (e.g., 96-plex to 384-plex) within a single flow cell lane.
- De Novo Versatility: Facilitates SNP discovery in “orphan” species lacking prior genomic resources, provided an appropriate bioinformatic strategy is employed.
- Logistical Streamlining: Eliminates the need for size fractionation, reducing sample handling through single-well digestion and ligation protocols.
The effectiveness of these genomic strategies is predicated on the dynamics of the target population, which governs the mapping resolution and the subsequent utility of the genotypic data.
| Population Type | Dynamics & Heterozygosity | Primary Genetic Utility |
|---|---|---|
| Association Mapping (AM) | High diversity, low heterozygosity in inbred panels. | Genome-wide association studies (GWAS) and diversity analysis. |
| Recombinant Inbred Lines (RIL) | Stabilized homozygous lines (F6+). | High-resolution linkage mapping and QTL identification. |
| Double Haploid (DH) | Completely homozygous stabilized lines. | Rapid linkage map construction and breeding efficiency. |
| Backcross Introgression (BIL) | Segregating/stabilized lines with specific donor segments. | Mapping wild alleles and pre-breeding for stress tolerance. |
| Intermated B73 × Mo17 (IBM) | Highly recombined lines (e.g., in maize). | Ultra-high resolution mapping of recombination hot spots. |
| F2 / BC1 / BC1F2 | Highly segregating with high heterozygosity rates. | Early-stage linkage mapping and segregation analysis. |
The precision of these genomic strategies begins with the biochemical rigor of the library preparation, where the choice of restriction enzymes determines the depth and uniformity of genomic coverage.
2. The Methodology of GBS: From DNA to Data
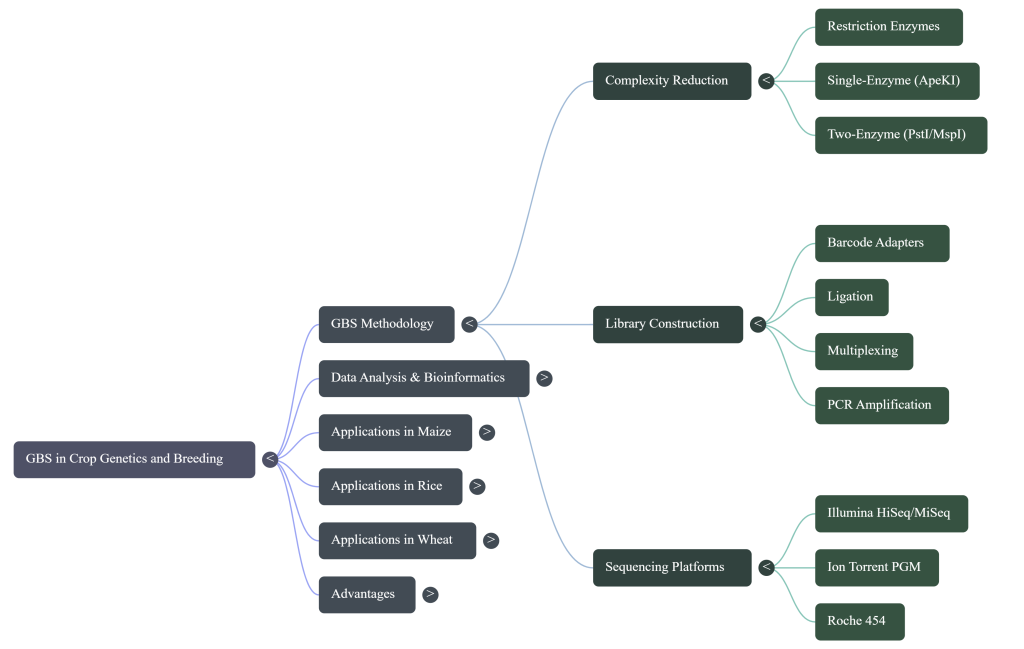
The core advantage of GBS is its focus on complexity reduction. For species with massive, repetitive genomes like maize or wheat, sequencing every base is often an inefficient use of resources. Instead, GBS targets specific genomic subsets flanking restriction enzyme sites, ensuring that identical orthologous regions are sampled across the entire breeding population.
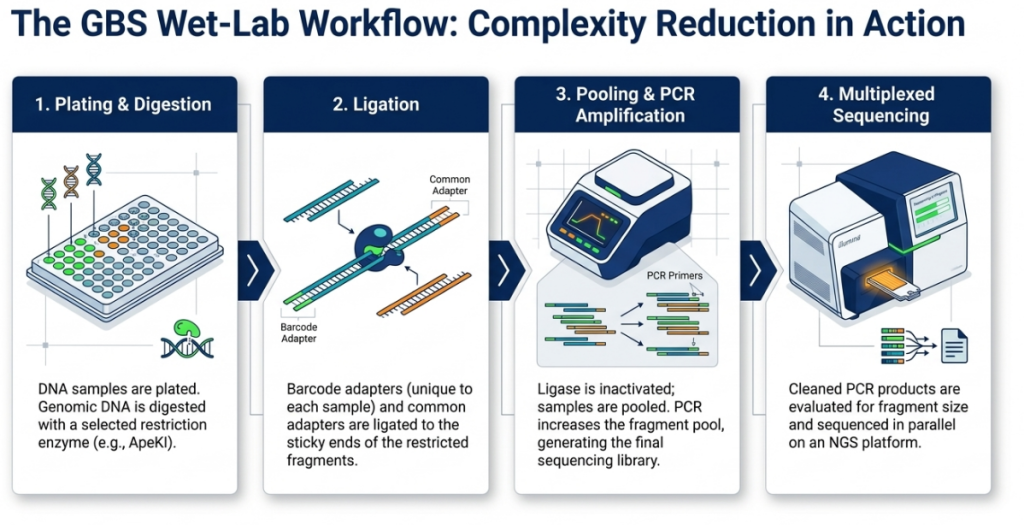
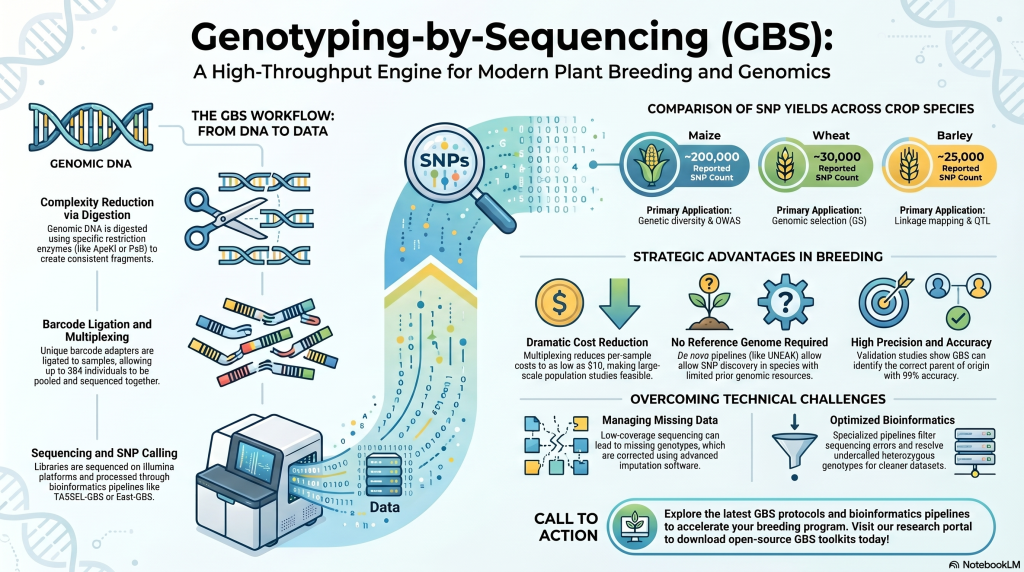
The GBS Protocol: A 5-Step Process
1. DNA Extraction:
Collecting high-quality DNA from leaf tissues of both the wild donor and the cultivated recipient.
2. DNA Digestion:
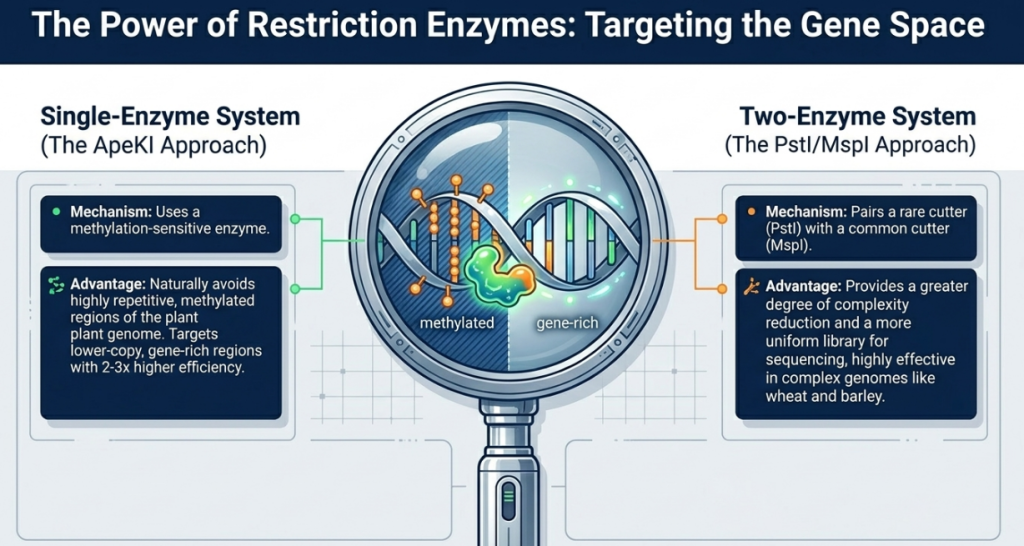
Using a Type II restriction enzyme (specifically ApeKI) to cut the genomic DNA at specific sites. This reduces genome complexity by avoiding repetitive regions, which is essential for sequencing large genomes.
Complexity Reduction via Restriction Endonucleases To avoid the computational bottlenecks of repetitive sequences, GBS utilizes Type II restriction enzymes. While the frequent cutter ApeKI is common for generating high marker density, a strategist may prefer a two-enzyme approach, such as PstI/MspI. This rare-cutter (PstI) and frequent-cutter (MspI) combination ensures a greater degree of complexity control; it prevents the formation of small, uninformative fragments and ensures that every sequenced fragment possesses a rare-cutter site. This targets low-copy, gene-rich regions, simplifying downstream alignment and ensuring a more uniform library than single-digest methods.
3. Adapter Ligation:
Attaching unique “barcodes” and adapters to the DNA fragments so that multiple samples can be sequenced simultaneously.
Barcode and Adapter Ligation Following digestion, unique barcode adapters are ligated to individual DNA samples, allowing for high-plexing (pooling up to 384 individuals). The level of multiplexing is a trade-off between cost and data integrity. In maize populations, 96-plex sequencing typically yields ~25% missing data, whereas 384-plex can result in ~55% missing data; these metrics are benchmarks for high-diversity species and may fluctuate in specific interspecific populations like the NSR rice population depending on the genome size and enzyme choice.
4. Amplification & Sequencing:
Using the Illumina platform to sequence the fragments in a massively parallel fashion.
Sequencing-by-Synthesis (SBS) The pooled library is processed on Illumina platforms (e.g., HiSeq 2500) using Sequencing-by-Synthesis:
- Clonal Amplification: DNA fragments are immobilized on a flow cell and amplified into local clusters.
- Fluorescence Detection: Reversible terminator bases with unique fluorescent labels are added.
- Digital Capture: A camera records the signal as each base is incorporated, enabling massive parallelization.
5. SNP Discovery:
Using the TASSEL bioinformatic pipeline to identify markers and construct high-density linkage maps.
Bioinformatic Processing and SNP Filtering
The bioinformatic pipeline serves as the quality control filter that determines the validity of the Single Nucleotide Polymorphisms (SNPs) interrogated.
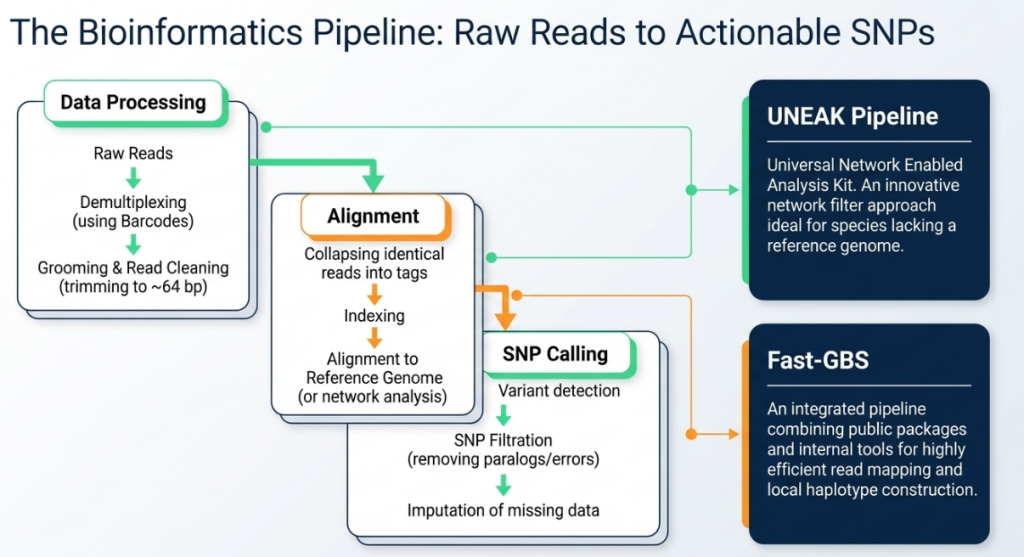
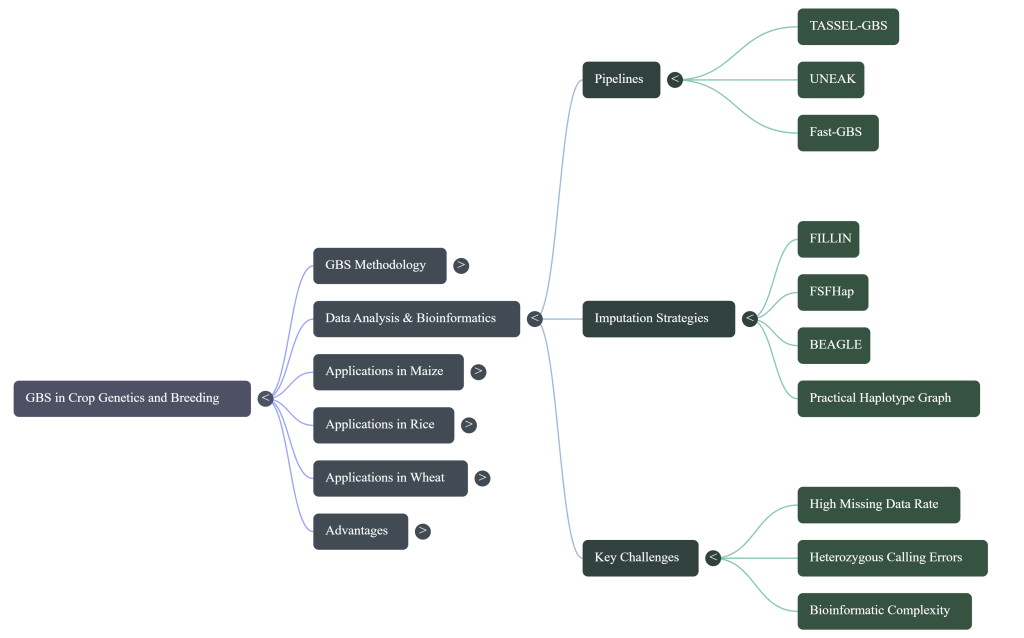
SNP Calling Pipelines
- Reference-Based (TASSEL GBS): Employed when a high-quality reference is available. For the NSR rice population, Nipponbare is used as a strategic proxy reference for the wild O. rufipogon parent, providing a framework for alignment.
- Network-Based (UNEAK): Designed for species without a reference genome, utilizing a network-based approach to distinguish true alleles from sequencing errors in sequence tags.
Rigorous Filtering Criteria To ensure the high-density framework is accurate, the following thresholds are strictly applied:
- Locus Integrity: Loci with >50% missing data are discarded to prevent map instability.
- Allelic Frequency: A Minor Allele Frequency (MAF) > 0.05 is required to exclude potential artifacts.
- Call Rate: A 90% threshold for polymorphic SNPs ensures consistency across the mapping population.
The Imputation Dilemma Imputation pipelines (e.g., FILLIN, FSFHap) can significantly reduce missing data (sometimes to <5%), but they introduce risks of genotyping error. Consequently, unimputed data is preferred for linkage mapping where precision is paramount, while imputed data is strategically utilized for GWAS to maximize marker density and map resolution.
The filtered SNP set provides the saturated framework required to overcome the historical limitations of lower-density marker sets.
The Core GBS Workflow
The GBS protocol streamlines the library preparation process, reducing handling and purification steps:
| Step | Process | Technical Objective |
|---|---|---|
| 1 | Library Construction | Genomic DNA is digested with restriction enzymes and ligated to unique barcode adapters for sample identification. |
| 2 | DNA Amplification | The pooled, adapter-ligated fragments are amplified via PCR to create a representative sequencing library. |
| 3 | Sequencing | High-throughput sequencing is performed (e.g., Illumina SBS) to generate millions of short-read sequences. |
Specialist’s Note: Complexity Reduction and Methylation Sensitivity
A geneticist must carefully select restriction enzymes to optimize genome coverage. While the single-enzyme approach often uses ApeKI, the two-enzyme system (e.g., PstI/MspI) provides a more uniform library and a higher degree of complexity reduction. Crucially, breeders must account for methylation patterns; the activity of MspI is inhibited by methylation at the external cytosine. By selecting these methylation-sensitive enzymes, GBS strategically targets lower-copy, gene-rich regions of the genome while avoiding highly methylated, repetitive heterochromatin.
RRS vs. Whole-Genome Resequencing (WGR)
While WGR offers a comprehensive view of the genome, Reduced-Representation Sequencing (RRS) via GBS is the more strategic choice for large-scale breeding. The cost-benefit ratio of RRS is unparalleled for populations requiring thousands of samples, as it achieves the marker density required for most applications at a fraction of the WGR cost per individual.
3. Data Management: Addressing the “Missing Data” Bottleneck
The high multiplexing levels inherent in GBS—essential for cost reduction—inevitably lead to a “missing data” bottleneck where some loci receive low sequence coverage. Bioinformatic imputation is a strategic necessity to transform these sparse datasets into the high-density SNP matrices required for modern analysis.
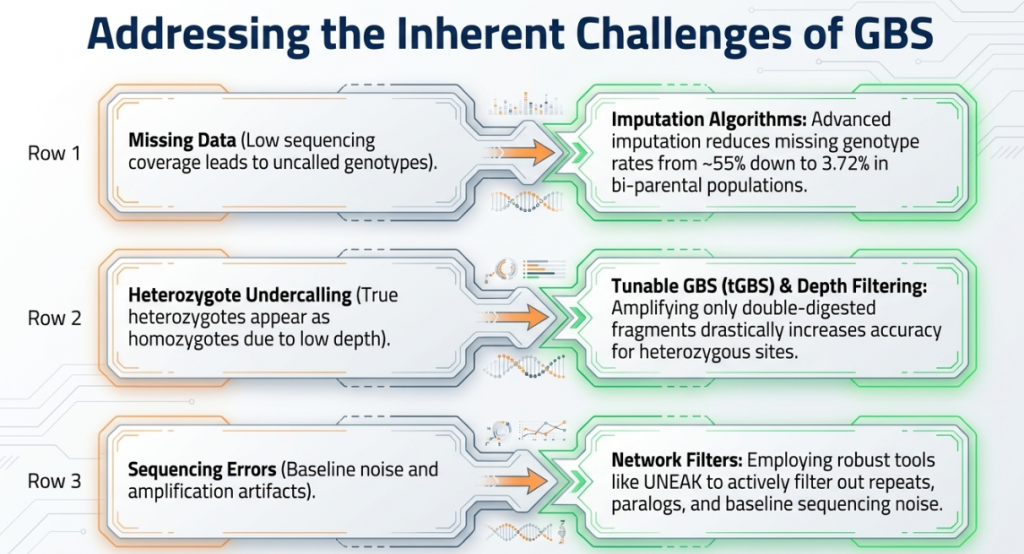
Multiplexing and Analysis-Specific Imputation Strategies
Data from CIMMYT maize studies highlight the trade-offs of multiplexing:
- 96-plex sequencing: Results in ~25% missing data.
- 384-plex sequencing: Results in ~55% missing data.
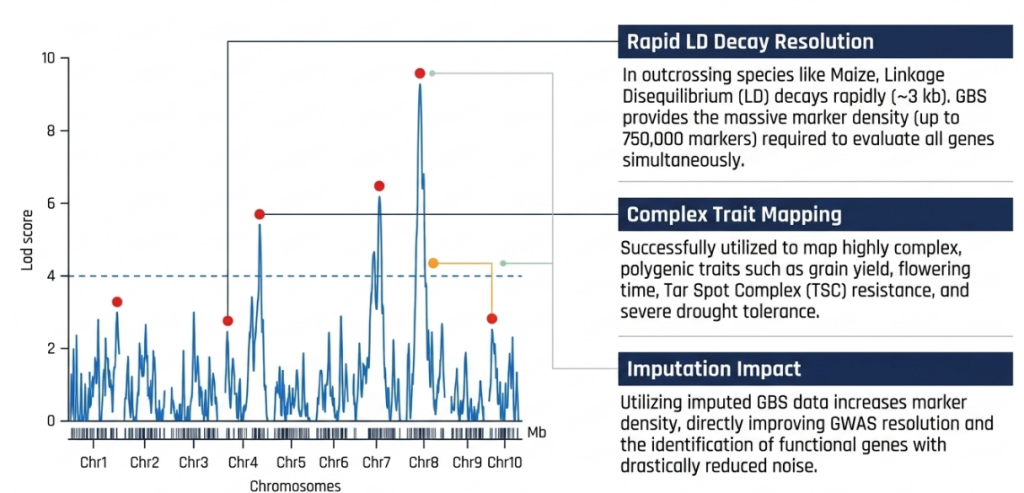
From a bioinformatics perspective, the decision to impute must be dictated by the intended analysis. For Genetic Diversity Analysis and Linkage Mapping, using unimputed data is often beneficial because it maintains a lower genotyping error rate (~0.70% in maize). Conversely, for Genome-Wide Association Studies (GWAS) and Genomic Prediction, imputation is required to maximize marker density and improve map resolution.
Bioinformatic Pipelines
Several specialized pipelines manage this data:
- UNEAK: A network-based SNP caller designed for species without a reference genome.
- FILLIN and FSFHap: Specialized tools for imputing inbred lines and full-sib families, respectively.
- TASSEL: An integrated platform for processing GBS data and performing downstream mapping and selection.
4. Strategic Applications in Modern Molecular Breeding
GBS transforms traditional selection into precision breeding by providing the high-resolution genetic data necessary for complex trait analysis.
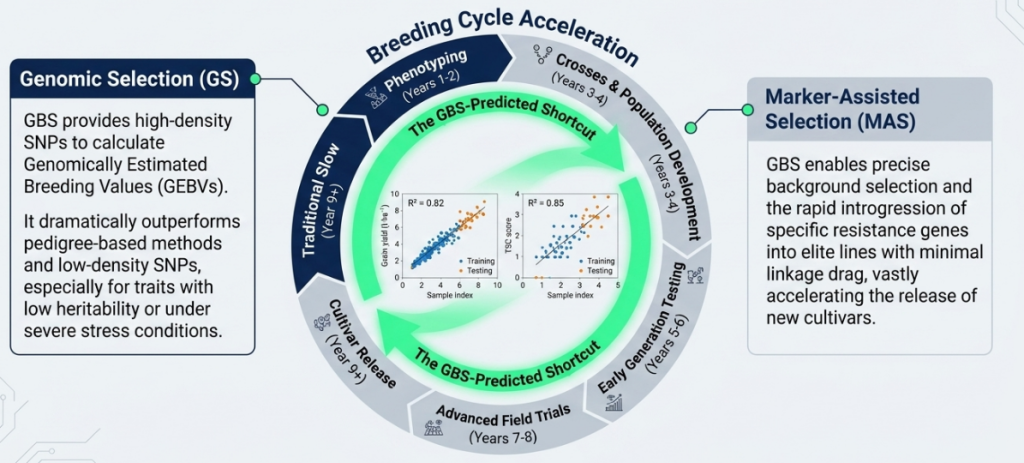
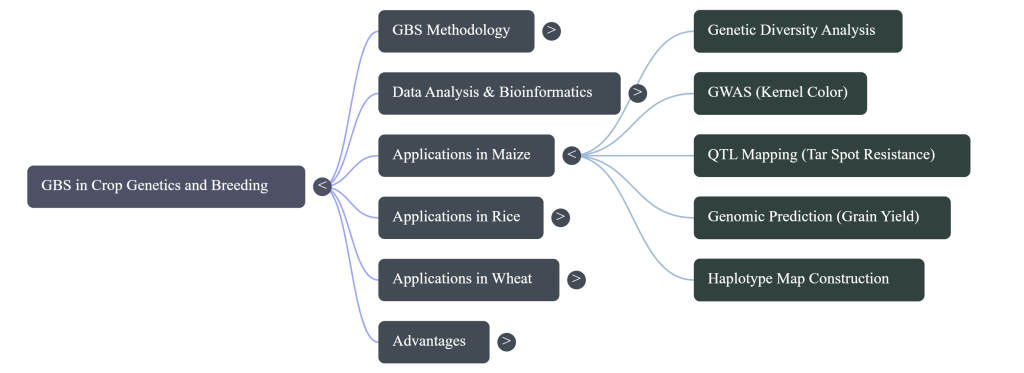
- Genetic Diversity Analysis: GBS identifies heterotic patterns and major subgroups within germplasm (e.g., CIMMYT Maize Lines), allowing breeders to organize genetic materials into productive clusters.
- Genome-Wide Association Studies (GWAS): High marker density allows for the discovery of specific genomic regions associated with complex traits, such as flowering time, by identifying candidate genes with single-base resolution.
- Linkage & QTL Mapping: The transition from SSR markers to high-density SNP maps enables the precise identification of Quantitative Trait Loci (QTLs).
- High-Density Linkage Map Construction
- The transition from raw SNP data to a structured genetic map provides the coordinate system for trait identification. Unlike physical maps, genetic maps order markers based on recombination frequencies, highlighting the functional inheritance of genomic segments.
- Mapping Algorithms and Parameters Using IciMapping v4.2, markers are grouped into linkage groups with a Logarithm of Odds (LOD) score threshold (typically LOD > 3). The Kosambi mapping function then converts recombination frequencies into centiMorgans (cM). This allows for the identification of recombination “hot spots” and “cold spots,” which are critical for predicting the success of introgressing donor segments.
- Interspecific Genomic Integration In the Oryza sativa x O. rufipogon NSR population, this workflow generated a saturated GBS-based SNP linkage map, successfully solving the historical constraint of “lower number of available polymorphic markers.” This saturated map featured 19,525 polymorphic SNPs across 12 chromosomes, spanning 3,713 cM with an average inter-marker distance of 5.25 cM. Such high resolution is essential for tracking wild introgression segments with precision.
- The transition from raw SNP data to a structured genetic map provides the coordinate system for trait identification. Unlike physical maps, genetic maps order markers based on recombination frequencies, highlighting the functional inheritance of genomic segments.
- QTL Mapping and Marker-Trait Association (MTA)
- The strategic objective of QTL mapping is the transformation of phenotypic variation into actionable genetic targets. Evaluating populations across multiple environments—specifically normal Recommended Dose of Phosphorus (RDP) vs. Low Phosphorus (low P) stress—is necessary to distinguish stable loci from environment-specific noise.
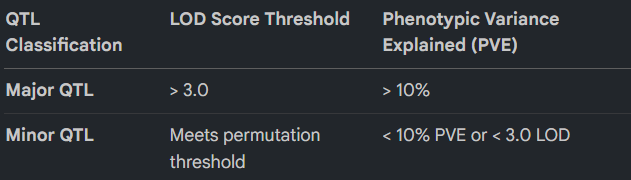
- Statistical Thresholding for Major QTLs Targets are prioritized based on their statistical strength and phenotypic impact.
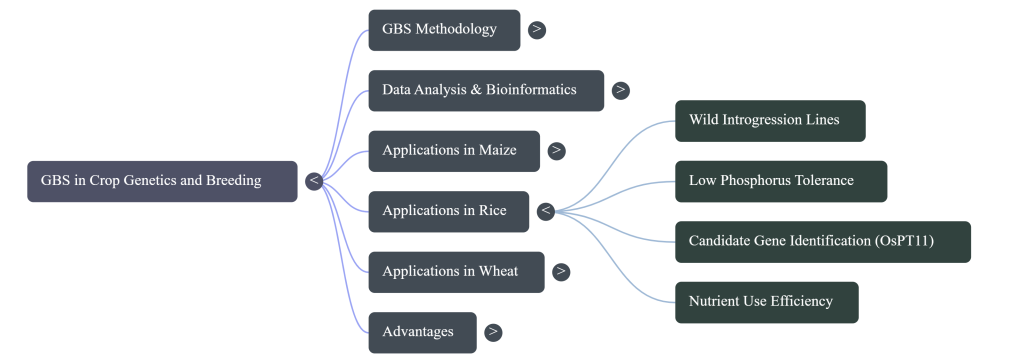
- Environmental Consistency and the Allelic Source Consistent QTLs detected across multiple environments are the highest-value targets for breeding. A critical realization of this analysis is the “So What?” of the allelic source: in the NSR population, the favourable alleles for low-P tolerance were contributed by the wild donor (O. rufipogon), while the grain weight alleles under normal RDP conditions originated from the recurrent parent (KMR3).
- Pleiotropy and Developmental Interdependence QTL hotspots, such as the region on Chromosome 1, often influence multiple traits (biomass, tiller number, total dry matter). However, a strategist must interpret these with caution: many of these traits are developmentally interdependent, meaning the “hotspot” may represent a single primary physiological change that ripples through correlated agronomic traits.
- The strategic objective of QTL mapping is the transformation of phenotypic variation into actionable genetic targets. Evaluating populations across multiple environments—specifically normal Recommended Dose of Phosphorus (RDP) vs. Low Phosphorus (low P) stress—is necessary to distinguish stable loci from environment-specific noise.
- High-Density Linkage Map Construction
- Genomic Prediction (GP): Unlike pedigree-based selection, GP utilizes all available GBS markers to predict phenotypic performance. This is applied at scale; for example, CIMMYT utilized GBS on 2022 breeding lines in Stage-1 yield trials to select for complex traits like grain yield with significantly higher accuracy than traditional methods.
- Candidate Gene Mining and Functional Validation
- The final mining phase narrows the broad QTL intervals (which may be several cM) down to specific functional genes.
- Tiered Genomic Scanning Protocols Geneticists employ a tiered scanning protocol using the RAP-DB genome browser:
- Broad Scan: Scanning a 1 cM interval on either side of the peak marker to identify all potential candidates.
- Precision Annotation: Scrutinizing the ±1 Kb flanking regions upstream and downstream of candidate genes to assess regulatory and coding sequence integrity.
- Candidate Gene Mining and Functional Validation
- The OsPT11 Case Study Within the Chromosome 1 hotspot—specifically a 298 kbp interval (Os01: 26,053,960 – 29,034,599)—the phosphate transporter gene OsPT11 was identified. This gene is vital for activating arbuscular mycorrhizal symbiosis, facilitating nutrient acquisition under phosphorus-limited conditions.
- Bioinformatic Network Analysis Tools like KnetMiner are utilized to visualize the functional landscape, classifying candidates based on:
- Biological Processes: e.g., transmembrane transport or inorganic phosphate homeostasis.
- Molecular Functions: e.g., protein kinase or transporter activity.
- Cellular Components: e.g., plasma membrane localization.
This integrated workflow—moving from high-density GBS and saturated linkage mapping to multi-environment QTL identification and precise gene mining—enables the development of next-generation, nutrient-use-efficient varieties. By bridging the gap between raw sequence data and functional biology, breeders can now strategically harness the untapped genetic potential of wild germplasm.
5. Case Study Analysis: Maize and Rice Breeding
Empirical evidence from major cereal crops validates the efficacy of GBS workflows in discovering novel genetic mechanisms.
Tropical Maize Populations
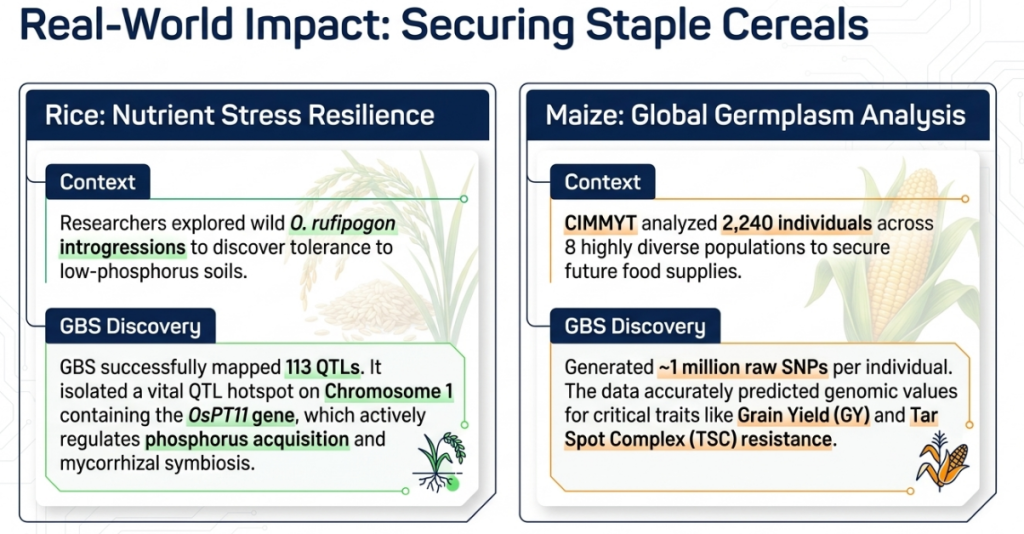
A study of 2,240 individuals across eight tropical maize populations demonstrated that imputation did not negatively influence prediction accuracy for genomic selection. This finding is critical, as it confirms that the higher marker density gained through imputation outweighs the risks of increased genotyping error, making GBS a robust tool for commercial-scale prediction.
Wild Rice Introgression (Oryza rufipogon)
GBS was instrumental in mapping interspecific populations derived from a cross between O. sativa and wild O. rufipogon. The source notes: “Exploring hidden stress-tolerant traits from wild species, and introgressing them into modern cultivars… are essential for climate resilient cultivation.”
Key findings from this research include:
- The identification of a QTL hotspot on Chromosome 1 associated with biomass, tiller number, and dry matter.
- The discovery of the OsPT11 phosphate transporter gene, which activates mycorrhizal symbiosis for enhanced phosphorus acquisition.
- Identification of major effect QTLs explaining up to 30.23% of the phenotypic variance under low-phosphorus stress.
6. Conclusion and Key Takeaways
Genotyping-by-Sequencing has solidified its status as the “ultimate MAS tool” by bridging the gap between raw genomic potential and field-ready, climate-resilient cultivars. By enabling the discovery of essential genes like OsPT11 and facilitating large-scale genomic prediction in Stage-1 trials, GBS provides the high-density data required to navigate the challenges of global food security. Breeders must integrate these high-density genomic tools into their routine pipelines to leverage novel genetic mechanisms and accelerate the development of next-generation crops.
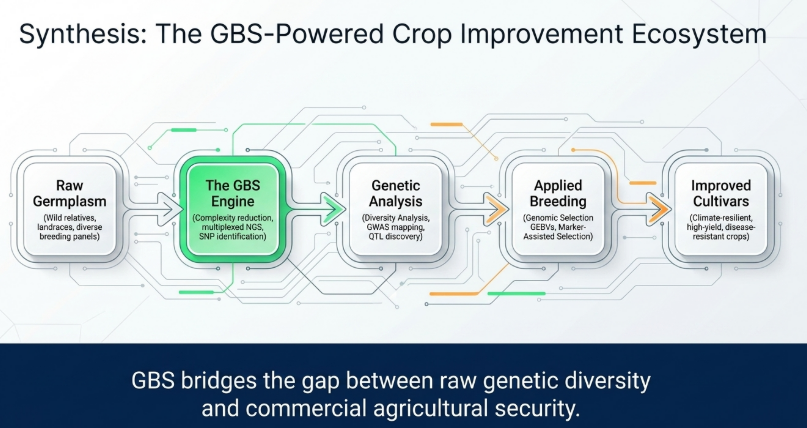
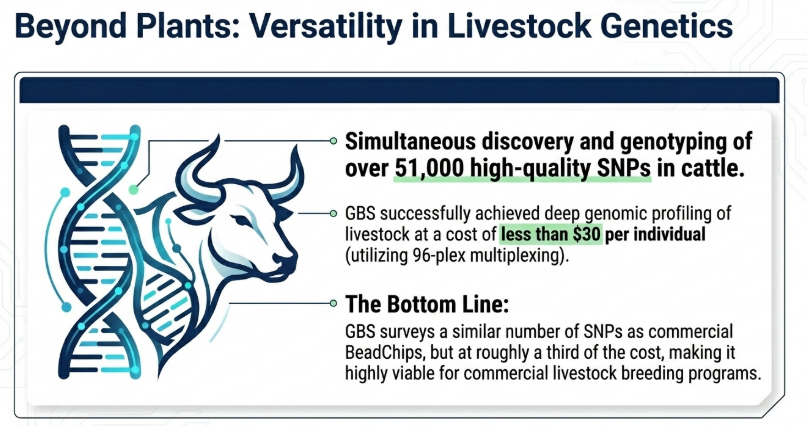
Image Summary
Questions/Answers
1. How does the GBS approach improve upon older genotyping methods?
Genotyping-by-sequencing (GBS) improves upon older genotyping methods—such as Restriction Fragment Length Polymorphism (RFLP), Simple Sequence Repeat (SSR), and Amplified Fragment Length Polymorphism (AFLP)—by leveraging next-generation sequencing (NGS) to provide a more efficient, high-throughput, and cost-effective approach.
The primary improvements of GBS over these older techniques include:
Simultaneous Discovery and Genotyping
- Traditional multi-step process: Older methods often require a lengthy, multi-step effort where polymorphic sites must first be identified through sequencing, followed by the development of specific assays (such as PCR primers or probes for SNP arrays) to score those variants in other individuals.
- GBS single-step approach: GBS eliminates the need for separate marker discovery and assay development stages. It uses sequences to simultaneously detect and score thousands to millions of Single Nucleotide Polymorphisms (SNPs) directly in the population of interest.
Reduced Cost and Increased Throughput
- Cost-effectiveness: GBS is significantly less expensive per sample and per marker than older PCR-fragment-based methods. In cattle, for example, GBS provided acceptable marker density at roughly one-third the cost of existing genotyping technologies.
- Massive Multiplexing: GBS allows for the multiplexing of hundreds of samples (e.g., 96-plex or 384-plex) in a single sequencing lane through the use of unique DNA barcodes. This economy of scale can push the cost per sample to very low levels.
Elimination of Ascertainment Bias
- The bias problem: Traditional high-density platforms like SNP arrays rely on pre-selected SNPs discovered from a limited set of founder genomes. This creates “ascertainment bias,” making the arrays less informative when applied to diverse populations or distant relatives that were not represented in the initial discovery panel.
- The GBS solution: Because GBS discovers markers directly from the individuals being genotyped, it removes ascertainment bias, making it effective for any population or species, including those with high genetic diversity.
No Requirement for Prior Genomic Knowledge
- Orphan crops and non-model species: Many older methods require extensive prior sequence information or a high-quality reference genome.
- Genomic flexibility: GBS can be used for “orphan” species lacking a complete genome sequence. De novo pipelines can identify polymorphisms by comparing GBS reads against one another, allowing breeders to work with novel germplasm without first developing specialized molecular tools.
Targeted Complexity Reduction
- Handling large, repetitive genomes: Older methods often struggle with species like maize, wheat, and barley, which have large genomes composed of over 80% repetitive DNA.
- Methylation sensitivity: GBS uses methylation-sensitive restriction enzymes to avoid repetitive regions and target the gene-rich, low-copy regions of the genome. This focuses sequencing effort on agronomically important areas and simplifies the computational challenges of aligning sequences in highly diverse species.
Procedural Simplicity
- Streamlined workflow: Compared to earlier complexity reduction methods like RAD (Restriction-site Associated DNA), GBS is technically simpler. It features single-well digestion and ligation, fewer DNA purification steps, and eliminates the need for fragment size selection in many protocols.
2. How does GBS remove ascertainment bias in diverse populations?
Genotyping-by-sequencing (GBS) removes ascertainment bias by simultaneously discovering and scoring markers directly within the population being studied, rather than relying on a fixed set of pre-selected markers derived from a limited group of individuals.
The mechanism for removing this bias involves several key factors:
Direct Discovery in the Target Population
- The Bias Problem: Traditional genotyping platforms, such as SNP arrays or chips, use a fixed set of SNPs discovered in a small “discovery panel” of founder genomes. This leads to ascertainment bias, where the markers are skewed toward common alleles found in those founders and may not be representative of the broader, more diverse population.
- The GBS Solution: Because GBS is a sequencing-based approach, it identifies polymorphisms as they are being sequenced in the actual samples of interest. This ensures that the markers are geographically and genetically representative of the specific population under investigation.
Capture of Rare and Novel Alleles
- Fixed vs. Flexible: Fixed-sequence assays (like microarrays) can only capture variants that were included in their design. Consequently, they often miss rare or population-specific alleles that are critical for understanding diversity in highly varied germplasm.
- Unbiased Survey: GBS allows for the identification of a broader spectrum of genetic variation, including novel and rare alleles that may have been missed by older, array-based platforms.
Independence from Prior Genomic Knowledge
- Orphan and Non-Model Species: Ascertainment bias is a significant hurdle for “orphan” or non-model species that lack extensive prior sequence information or high-quality reference genomes.
- De Novo Capability: GBS can be used for these species because it does not require a pre-designed assay. Researchers can use de novo pipelines to identify polymorphisms by comparing reads against each other, allowing for accurate genotyping and population structure analysis without any prior knowledge of the species’ diversity.
Enhanced Representation in Complex Genomes
- Structural Variation: In highly diverse species like maize, structural variations (such as presence/absence variation) can make it difficult to find the invariant regions required for traditional primer binding. GBS circumvents this by sequencing the genomic subsets directly, which is advantageous because sequencing efficiency for genotyping scales directly with genetic diversity.
- Gene-Rich Targeting: By using methylation-sensitive restriction enzymes, GBS avoids repetitive, non-coding regions and targets the gene-rich, low-copy areas of the genome, providing high-density marker data where it is most agronomically relevant.
3. Which restriction enzymes are typically used for GBS complexity reduction?
The selection of restriction enzymes (REs) is a critical step in the genotyping-by-sequencing (GBS) process, as it determines how the genome is sampled and the degree of complexity reduction achieved.
The enzymes typically used are categorized into single-enzyme and double-enzyme approaches:
Commonly Used Single-Enzyme Systems
- ApeKI: This is one of the most frequently used enzymes in GBS, particularly for species like maize, soybean, and rice. It is a type II restriction endonuclease that recognizes a degenerate 5 bp sequence (GCWGC, where W is A or T). It is favored because it is partially methylation-sensitive, which allows it to avoid repetitive, highly methylated regions of the genome and target lower-copy, gene-rich areas.
- PstI: While often part of a double-digest, PstI alone has been cited as a high-performing enzyme for cattle, where it produced a higher density of SNPs compared to ApeKI or EcoT22I.
- MseI: This frequent cutter has been used for soybean, though some studies suggest it may produce a high proportion of fragments that are too small for optimal sequencing performance.
- KpnI: In some rice pre-breeding applications, PstI was replaced with KpnI to achieve higher per-site coverage of sequence reads, allowing for increased sample multiplexing.
Commonly Used Double-Enzyme Systems
The two-enzyme approach, often employing a rare cutter and a frequent cutter, is used to achieve more uniform complexity reduction and to better target specific genomic regions.
- PstI and MspI: This is the most common double-digest combination, widely applied to large and complex genomes such as wheat, barley, oat, and faba bean. In this pairing, PstI acts as the rare cutter and MspI as the frequent cutter.
- NsiI and NlaIII: This combination has been utilized for high-density marker generation in olive tree research.
- EcoRI and BfaI: These were used in early proof-of-concept GBS studies for Arabidopsis.
Why These Specific Enzymes are Chosen
- Methylation Sensitivity: Many typically used REs (like ApeKI, PstI, and MspI) are sensitive to DNA methylation. This is strategic for plant genomics because agronomically important regions are often hypomethylated (low-copy, gene-rich), while repetitive transposable elements are generally hypermethylated and thus avoided by the enzymes.
- Fragment Size Distribution: The goal is to maximize the number of fragments that fall within the ideal range for sequencing (typically 100–400 bp). In silico digestion is often performed prior to lab work to predict which enzyme will produce the most useful fragment distribution for a specific species’ genome.
- Overhangs: Enzymes that leave 2 to 3 bp overhangs (sticky ends) are preferred because they promote more efficient adapter ligation compared to single-nucleotide overhangs.
4. Why use rare and frequent cutters in double-enzyme GBS?
The use of a rare cutter and a frequent cutter in double-enzyme Genotyping-by-Sequencing (GBS)—a method pioneered by Poland et al. (2012)—is primarily designed to achieve a greater and more uniform degree of genome complexity reduction compared to single-enzyme methods. This approach is particularly advantageous for species with large, repeat-rich, and complex genomes like wheat, barley, and faba bean.
The synergy between these two types of enzymes serves several critical functions:
Targeting Agronomically Relevant Regions
- Rare Cutters (e.g., PstI): These enzymes recognize longer or less frequent sequences. Often, methylation-sensitive rare cutters like PstI are chosen because they preferentially target low-copy, gene-rich, and hypomethylated regions of the genome while avoiding highly methylated repetitive transposable elements.
- Frequent Cutters (e.g., MspI): These enzymes (also known as common cutters) cut the DNA at many more sites. Their role is to increase the efficiency of complexity reduction by breaking down the larger fragments generated by the rare cutter into smaller, more sequenceable sizes.
Enhanced Complexity Reduction and Uniformity
- Uniform Libraries: The combination creates a more uniform library for sequencing than the original single-enzyme protocols (like those using ApeKI), ensuring consistent sampling across informative genomic regions.
- Reduced Fragment Count: In silico studies in species like lentil have shown that a double-digest approach (e.g., PstI/MspI) can produce significantly fewer fragments (up to 17% less) than a single-cutter method, further narrowing the focus to high-quality markers.
- Precise Control: Using two enzymes allows for more precise control over the number of fragments obtained, making it easier to adjust the protocol for different species or experimental goals.
Specific Amplification and Bioinformatics Benefits
- Y-Adapters and Specificity: In this protocol, digested DNA fragments have alternate ends (one from the rare cutter and one from the frequent cutter). By using specific adapters—including Y-adapters—researchers can ensure that only fragments with both a rare-cut and a frequent-cut end are amplified. This prevents the over-amplification of the much more numerous “frequent-frequent” fragments, which would otherwise dominate the sequencing effort.
- Simplified Analysis: By avoiding the sequencing of repetitive regions, the double-enzyme approach results in a more straightforward bioinformatics analysis, as alignment problems caused by repetitive DNA are minimized.
Commonly Used Enzyme Pairs
- PstI and MspI: The most frequent combination, widely applied in cereal crops like wheat, barley, and oat, as well as legumes like faba bean.
- NsiI and NlaIII: Successfully utilized for high-density marker generation in olive tree research to simultaneously perform variant calling and metagenome profiling.
5. How do de novo pipelines work for orphan species?
De novo pipelines enable the genotyping of orphan species—those lacking a complete reference genome—by comparing sequence reads directly against each other to identify polymorphisms. Instead of aligning reads to a pre-existing genomic scaffold, these pipelines establish a local “reference map” centered around the restriction sites used during library preparation.
The two most widely used de novo pipelines are UNEAK and Stacks, each employing distinct algorithmic strategies:
UNEAK (Universal Network Enabled Analysis Kit)
Integrated into the TASSEL package, the UNEAK pipeline follows a streamlined tag-based workflow:
- Trimming and Collapsing: Raw sequence reads are trimmed to a uniform length (typically 64 bp), and identical reads are collapsed into “tags”.
- Pairwise Alignment: The pipeline performs an internal pairwise alignment of all unique tags to identify pairs that differ by only a single nucleotide mismatch, which are then flagged as candidate SNPs.
- Network Filtering: A specialized “network filter” is applied to these pairs to distinguish true allelic variation from errors, repeats, and paralogs.
- Reference Consensus: The consensus sequence of these validated read clusters effectively becomes the reference for that population.
Stacks (De Novo Workflow)
Stacks processes data by grouping reads into individual-specific loci and then merging them across the population:
- Locus Grouping: Data from each individual are grouped into loci, and polymorphic nucleotide sites are identified within those groups.
- Catalog Construction: These individual loci are grouped together across all sampled individuals to build a comprehensive “catalog” of the species’ variation.
- Genotype Scoring: Loci from each individual are matched against the catalog to determine their specific allelic state and score genotypes.
Key Advantages and Limitations
- Flexibility: These pipelines allow breeders to conduct genomic selection or population structure analysis on novel germplasm without first developing specialized molecular tools.
- SNP Yield: De novo pipelines typically identify fewer SNPs than reference-based approaches; for example, in soybean tests, de novo pipelines called 13,000–24,000 SNPs compared to 25,000–54,000 with a reference.
- Biological Assumptions: Some tools, such as UNEAK, assume diploidy, which can limit their accuracy when applied to polyploid orphan species.
- Imputation Challenges: Because de novo pipelines lack physical marker positions and haplotype information, missing data imputation is significantly more challenging than in reference-based systems.
- Dominant Marker Alternative: In the absence of any reference formation, sequence tags can simply be treated as dominant markers for kinship and selection analyses.
6. Can GBS identify QTLs for other environmental stresses?
Yes, Genotyping-by-Sequencing (GBS) has been successfully employed to identify Quantitative Trait Loci (QTLs) and genomic regions associated with a wide array of environmental stresses, ranging from nutrient deficiencies to extreme temperatures and biological threats. Because GBS provides high-density marker coverage across the entire genome, it is particularly effective for dissecting the complex, polygenic nature of these adaptive traits.
Abiotic Environmental Stresses
GBS has been used to map QTLs for numerous non-biological environmental pressures:
- Nutrient and Mineral Stress: Beyond phosphorus deficiency (such as identifying the OsPT11 transporter gene in rice), GBS has identified QTLs for aluminum tolerance, iron deficiency chlorosis (IDC) in soybean, and zinc content in rice.
- Toxic Element Accumulation: Researchers have used GBS to conduct Genome-Wide Association Studies (GWAS) to find markers related to heavy metal accumulation, specifically cadmium (Cd) accumulation in rice.
- Water-Related Stresses: In addition to drought tolerance and water uptake (e.g., rice QTLs qWU7 and qWU11), GBS has been used to detect major QTLs associated with flooding tolerance in soybean.
- Temperature Extremes: GBS and related transcriptomic approaches (BSR-Seq) have been used to investigate cold stress responses in kiwi fruit and freeze tolerance in citrus. It has also been applied to identify selective sweeps and adaptive genes for heat stress in crops like wheat and cotton.
- Salinity: GBS is a standard tool for mapping salinity tolerance in various species, identifying specific regions such as qSNC11 for sodium concentration in rice and selective signatures for salinity in wheat.
Biotic (Biological) Stresses
GBS is also a primary tool for mapping resistance to environmental biological threats:
- Diseases: It has identified QTLs for a vast range of pathogens, including citrus greening (HLB), Tar Spot Complex and Maize Lethal Necrosis in maize, and various rots (such as Phytophthora root rot and charcoal rot) or mildews in soybean.
- Pests and Parasites: High-density GBS maps have identified major and minor QTLs for root-knot nematode (RKN) resistance in muskmelon (C. melo) and citrus.
Why GBS is Effective for Stress Mapping
- High Resolution for Complex Traits: Most environmental stress tolerances are governed by many genes with small individual effects. The thousands to millions of SNPs generated by GBS allow for high-resolution mapping that can detect these subtle genetic signals.
- Adaptation in Diverse Populations: GBS removes ascertainment bias, which is crucial for studying environmental adaptation in wild relatives or landraces that have evolved unique survival mechanisms not present in elite, modern cultivars.
- Applicability to “Orphan” Species: Many species naturally resilient to harsh environments lack a reference genome. GBS de novo pipelines allow for QTL mapping in these species, enabling breeders to tap into a “genetic reservoir” of stress-tolerance alleles.
7. Can GBS identify QTLs for heat stress in wheat?
Genotyping-by-sequencing (GBS) is a standard tool for identifying quantitative trait loci (QTLs) and selection signatures associated with various environmental and abiotic stresses across many plant species, including wheat. While some sources focus on heat stress specifically in crops like maize and common bean, the provided materials extensively detail GBS’s utility in wheat for mapping adaptations to environmental pressures and abiotic stress.
According to the sources, GBS assists in identifying QTLs for heat stress in the following ways:
- Mapping Environmental Adaptation: In bread wheat, GBS has been used to identify “selection signatures” and genomic regions under natural or artificial selection. These regions contain genes involved in regulatory processes and pathways that are significant for the differentiation of populations in response to environmental pressures and stress adaptation.
- Tapping Into Genetic Reservoirs: Plant genetic resources (PGR), such as wheat landraces, are described as a “treasure trove” of gene variants evolved through adaptation. GBS is used to characterize these resources to identify alleles that provide resilience to hostile conditions associated with climate change, specifically heat and drought.
- Cereal parallels: GBS has successfully identified donors for drought, heat, and combined drought and heat tolerance in related cereal crops like maize. These studies demonstrate GBS’s power in dissecting the complex, polygenic architecture of heat tolerance, which is governed by many small-effect loci.
- High-Resolution Discovery: Because GBS delivers tens of thousands to millions of high-density markers, it provides the resolution necessary for genome-wide association studies (GWAS) and genomic selection (GS) for complex adaptive mechanisms. This approach is particularly effective for traits like stress resistance that are governed by multiple genes with small individual effects.
- Overcoming Genome Complexity: Even in the large and repeat-rich hexaploid wheat genome, GBS enables the identification of polymorphisms associated with adaptation to stresses and provides a level of resolution in genomic diversity unattainable with classical markers.
While the sources specifically mention GBS identifying selection signatures for general “stress adaptation” in Iranian wheat landraces, they also reference broader research where genomics and multi-omics strategies are applied to crops under heat stress.
What are the specific bioinformatics challenges for orphan species?
For orphan species—those lacking a complete reference genome sequence—the primary bioinformatics challenge is the necessity of identifying and scoring polymorphisms de novo. This lack of a genomic scaffold introduces several specific technical and analytical hurdles.
1. Difficulties with Data Imputation
One of the most significant bottlenecks for orphan species is missing data imputation. In reference-based systems, positional information and haplotype structure allow for high-accuracy imputation of missing genotypes. However, in de novo pipelines:
- There is no physical marker position to anchor reads, making it much more challenging to predict unknown genetic loci.
- Tolerating high amounts of missing data (e.g., 80%) is often unrealistic for de novo pipelines because they lack the positional context needed to “fill in” the gaps.
- Setting lower thresholds for missing data to maintain accuracy can substantially decrease the final SNP count; for example, one study noted a drop to just ~5,000 SNPs for an orphan crop compared to 25,000–35,000 in reference-based counterparts.
2. Reduced SNP Yield and Sensitivity
Bioinformatics pipelines for orphan species typically identify significantly fewer polymorphisms than reference-based approaches.
- Subset Capture: Reference-based pipelines can yield 5 to 7 times more high-quality SNP markers than de novo tools under realistic conditions.
- Length Limitations: Some widespread de novo tools, such as UNEAK, clip all reads to a uniform short length (e.g., 64 bp), which increases the risk of erroneous calls and limits the potential to identify variants that reside further into the sequence.
3. Complexity of Polyploidy
Many orphan species are polyploid, which adds a layer of extreme bioinformatic complexity:
- Homoeologue Confounding: Pipelines must distinguish between true SNPs (allelic variation within a locus) and homoeologous SNPs (differences between sub-genomes), which share 96–98% identity.
- Diploidy Assumptions: Common de novo tools like UNEAK often assume diploidy, which can severely limit their performance and accuracy when applied to the complex genomes of many orphan crops.
4. Alignment and Filtering Errors
Without a reference genome to anchor sequences, distinguishing true genetic variation from technical errors is difficult.
- Paralogs and Repeats: It is harder to identify reads originating from paralogous regions or repetitive DNA, which are the source of most genotyping errors in species with large, complex genomes.
- Run-to-Run Variation: Low sequencing coverage can lead to non-uniform sequencing of genomic regions between different runs, causing different SNPs to be detected each time and complicating long-term breeding data.
5. Lack of Infrastructure and Expertise
Orphan species are often studied in resource-limited regions where bioinformatics infrastructure (high-performance computing, large-scale data storage) and specialized expertise in quantitative genetics are scarce. Managing the massive volume of genetic data generated by short-read sequencing remains a “major bottleneck” for these programs
References
Abdelhamid, S., Araouki, A., Chehab, H., Olukolu, B. A., & Ashrafi, H. (2026). Genetic diversity and population structure analysis in Tunisian Olive collection using genotyping-by-sequencing. Euro-Mediterranean Journal for Environmental Integration, 11(1). https://doi.org/10.1007/s41207-025-01031-6
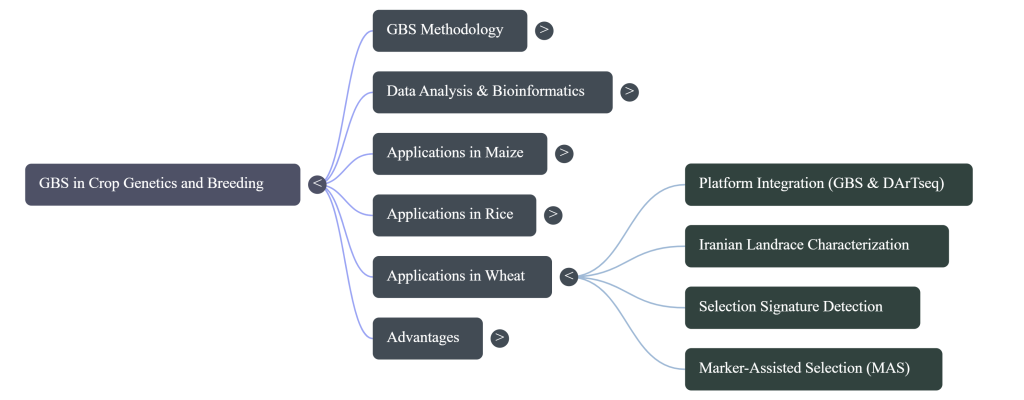
Abdi, H., Alipour, H., Bernousi, I., Darvishzadeh, R., Fatanatvash, S., & Türkoğlu, A. (2026). Integration and imputation of GBS-derived and DArTseq-derived SNP markers in assessing genetic diversity of bread wheat genotypes. BMC Genomics, 27(1). https://doi.org/10.1186/s12864-026-12685-z
Aleza, P., Garcia-Lor, A., Mournet, P., Navarro, L., & Ollitrault, P. (2026). Genotyping-by-Sequencing Reveals Marker-Based Genome Stability in Tetraploid Clementines for Triploid Breeding. Plants, 15(2). https://doi.org/10.3390/plants15020336
Almarri, N. B., Ahmad, S., Alsofuani, N. M., Osman, S., Ibrahim, M. A., Mostafa, S. M., Al-Haidar, O. A., Alomran, S. M., Alrashidi, I., & Tariq, R. (2026). Genotyping-by-sequencing -based genome-wide SNP profiling and DNA fingerprinting of Saudi Arabian faba bean germplasm. BMC Plant Biology. https://doi.org/10.1186/s12870-026-08406-z
Balakrishnan, D., Magudeeswari, P., Surapaneni, M., Kumar, A. P., Anantha, M. S., Saiprasad, S. V., Neelamraju, S., & Sundaram, R. M. (2026). Genotyping by sequencing of wild interspecific mapping population detected novel genetic locus harbouring OsPT11 for rice yield under nutrient stress conditions. Plant Physiology and Biochemistry, 233. https://doi.org/10.1016/j.plaphy.2026.111231
De Donato, M., Peters, S. O., Mitchell, S. E., Hussain, T., & Imumorin, I. G. (2013). Genotyping-by-Sequencing (GBS): A Novel, Efficient and Cost-Effective Genotyping Method for Cattle Using Next-Generation Sequencing. PLoS ONE, 8(5). https://doi.org/10.1371/journal.pone.0062137
Deol, J. K., Ramekar, S., & Dutt, M. (2025). The potential value of genotyping by sequencing (GBS) strategies for combating citrus diseases. In Euphytica (Vol. 221, Number 5). Springer Science and Business Media B.V. https://doi.org/10.1007/s10681-025-03511-w
Deschamps, S., Llaca, V., & May, G. D. (2012). Genotyping-by-sequencing in plants. In Biology (Vol. 1, Number 3, pp. 460–483). MDPI AG. https://doi.org/10.3390/biology1030460
Elshire, R. J., Glaubitz, J. C., Sun, Q., Poland, J. A., Kawamoto, K., Buckler, E. S., & Mitchell, S. E. (2011). A robust, simple genotyping-by-sequencing (GBS) approach for high diversity species. PLoS ONE, 6(5). https://doi.org/10.1371/journal.pone.0019379
He, J., Zhao, X., Laroche, A., Lu, Z. X., Liu, H. K., & Li, Z. (2014). Genotyping-by-sequencing (GBS), An ultimate marker-assisted selection (MAS) tool to accelerate plant breeding. In Frontiers in Plant Science (Vol. 5, Number SEP). Frontiers Media S.A. https://doi.org/10.3389/fpls.2014.00484
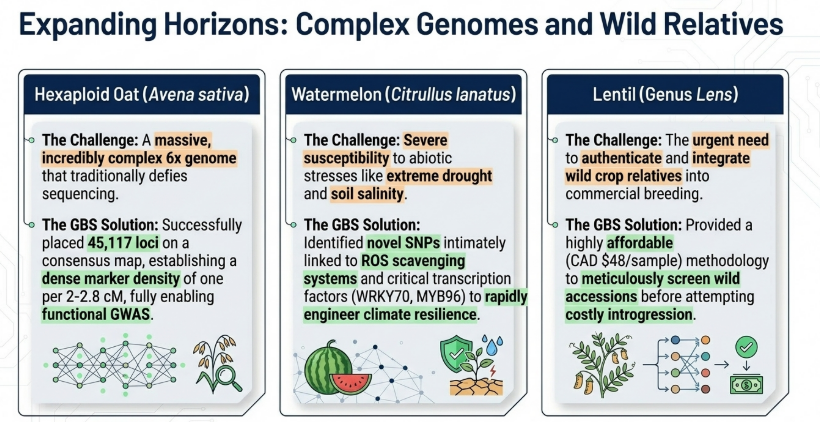
Huang, Y. F., Poland, J. A., Wight, C. P., Jackson, E. W., & Tinker, N. A. (2014). Using Genotyping-By-Sequencing (GBS) for genomic discovery in cultivated oat. PLoS ONE, 9(7). https://doi.org/10.1371/journal.pone.0102448
Kang, J., Hess, M. K., Dodds, K. G., Brauning, R., McEwan, J. C., Foote, B. J., Foote, J. F., Konkolewska, A., Clarke, S. M., & Hess, A. S. (2026). SimGBS: a rapid method for simulating large-scale genotyping-by-sequencing data. BMC Bioinformatics, 27(1). https://doi.org/10.1186/s12859-025-06343-6
Kaur, A., Sharma, M., Bhatia, S. K., Sharma, D., Sharma, S. P., Kaur, A., & Sarao, N. K. (2026). High-resolution QTL mapping of horticultural traits in muskmelon (Cucumis melo L.) using genotyping-by-sequencing. Euphytica, 222(5). https://doi.org/10.1007/s10681-026-03709-6
Kostyukova, V., Kenzhebekova, R., Protsenko, E., Dulat, B., Khusnitdinova, M., & Gritsenko, D. (2026). Next-Generation Genotyping: Innovations Driving Plant Genomic Improvement. In Life (Vol. 16, Number 3). Multidisciplinary Digital Publishing Institute (MDPI). https://doi.org/10.3390/life16030521
Nyirahabimana, F., & Solmaz, İ. (2025). Cutting-Edge of Genotyping by Sequencing (GBS) for Improving Drought and Salinity Stress Tolerance in Watermelon (Citrullus lanatus L.): A Review. In Plant Molecular Biology Reporter (Vol. 43, Number 1, pp. 1–10). Springer. https://doi.org/10.1007/s11105-024-01465-2
Pagnotta, M. A. (2026). Genomic Tools for Assessing Plant Diversity in the 2020s: From PCR-Based Markers to High-Throughput Sequencing and eDNA. In Diversity (Vol. 18, Number 4). Multidisciplinary Digital Publishing Institute (MDPI). https://doi.org/10.3390/d18040208
Panahi, B., Hosseinzadeh Gharajeh, N., & Mohammadzadeh Jalaly, H. (2025). Advances in barley germplasm diversity characterization through next-generation sequencing approach. In Genetic Resources and Crop Evolution (Vol. 72, Number 4, pp. 3829–3843). Springer Nature. https://doi.org/10.1007/s10722-024-02196-9
Reyes, V. P., Kitony, J. K., Nishiuchi, S., Makihara, D., & Doi, K. (2022). Utilization of Genotyping-by-Sequencing (GBS) for Rice Pre-Breeding and Improvement: A Review. In Life (Vol. 12, Number 11). MDPI. https://doi.org/10.3390/life12111752
Sharma, M., Kaur, A., Bhatia, S. K., Sharma, S. P., Kaur, S., Narang, D., Leela, N. C., Kumari, N., & Sarao, N. K. (2026). Genetic mapping of quantitative trait loci associated with nematode resistance in melon using genotyping-by-sequencing. Frontiers in Plant Science, 17. https://doi.org/10.3389/fpls.2026.1744881
Sonah, H., Bastien, M., Iquira, E., Tardivel, A., Légaré, G., Boyle, B., Normandeau, É., Laroche, J., Larose, S., Jean, M., & Belzile, F. (2013). An Improved Genotyping by Sequencing (GBS) Approach Offering Increased Versatility and Efficiency of SNP Discovery and Genotyping. PLoS ONE, 8(1). https://doi.org/10.1371/journal.pone.0054603
Torkamaneh, D., Laroche, J., & Belzile, F. (2016). Genome-wide SNP calling from genotyping by sequencing (GBS) data: A comparison of seven pipelines and two sequencing technologies. PLoS ONE, 11(8). https://doi.org/10.1371/journal.pone.0161333
Wang, N., Yuan, Y., Wang, H., Yu, D., Liu, Y., Zhang, A., Gowda, M., Nair, S. K., Hao, Z., Lu, Y., San Vicente, F., Prasanna, B. M., Li, X., & Zhang, X. (2020). Applications of genotyping-by-sequencing (GBS) in maize genetics and breeding. Scientific Reports, 10(1). https://doi.org/10.1038/s41598-020-73321-8
Werghi, S., Koboyi, B. W., Chan-Rodriguez, D., & Bolibok-Brągoszewska, H. (2025). Genome-Wide, High-Density Genotyping Approaches for Plant Germplasm Characterisation (Methods and Applications). In International Journal of Molecular Sciences (Vol. 26, Number 24). Multidisciplinary Digital Publishing Institute (MDPI). https://doi.org/10.3390/ijms262411833
Wong, M. M. L., Gujaria-Verma, N., Ramsay, L., Yuan, H. Y., Caron, C., Diapari, M., Vandenberg, A., & Bett, K. E. (2015). Classification and characterization of species within the genus lens using genotyping-by-sequencing (GBS). PLoS ONE, 10(3). https://doi.org/10.1371/journal.pone.0122025
Yoon, C. W., Kang, Y., Chung, J. W., Bulos, M., Hwang, T. Y., & Yu, J. K. (2025). Harnessing genomic technologies for modern soybean breeding. In Journal of Crop Science and Biotechnology. Springer. https://doi.org/10.1007/s12892-025-00328-w


Related posts:
 The Evolutionary Genomics of Crop Plants: From Ancestral Polyploidy to Modern Pangenomes
 Global Strategies for Crop Germplasm Conservation: Integrating Farmer-Based In Situ Methods with Biotechnological Innovation
 The Architecture of Agricultural Resilience: A Definitive Guide to Centers of Origin and Genetic Diversity
 Evolutionary Dynamics of Plant Breeding Systems: A Comprehensive Analysis of Mating Strategies
 The Secret of the Seed: An Aspiring Learner’s Guide to Hybrid Vigor and Plant Development