1. Introduction: The Enduring Legacy of the Chain-Termination Method
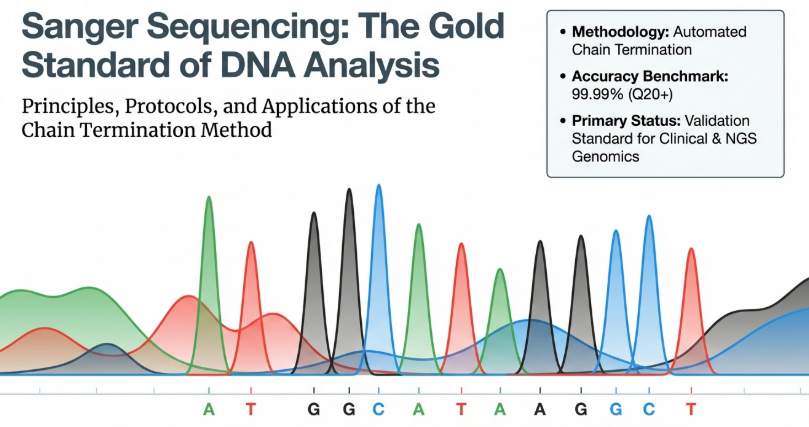
In the high-stakes environment of molecular diagnostics, Sanger sequencing remains the undisputed “gold standard” for nucleic acid verification. Since its 1977 inception, this methodology has provided the essential bedrock for genomic discovery, offering a level of single-pass precision that bridges historical breakthroughs with the rigorous demands of modern clinical medicine. Its strategic importance lies in its unparalleled 99.99% accuracy, making it the final authority in validating synthetic inserts, site-directed mutagenesis, and the complex findings of larger genomics initiatives.
The technical core of this method resides in the biochemical principle of chain termination, allowing for the precise determination of nucleotide bases within a DNA segment. While the field has transitioned from manual, radioactive slab-gel systems to automated, fluorescent capillary electrophoresis, Sanger sequencing continues to thrive as an indispensable validation layer. This guide provides a strategic overview of the technology, addressing the biochemical mechanisms, operational rigor, and diagnostic standards required to maintain the highest levels of DNA sequencing fidelity.
2. The Biochemical Foundation: Dideoxy Chain Termination Explained
A profound understanding of sequencing chemistry is the first line of defense in troubleshooting and experimental design. The integrity of diagnostic data is a direct product of the stoichiometric interaction between enzymes and modified nucleotides.
Key Differentiators: dNTPs vs. ddNTPs
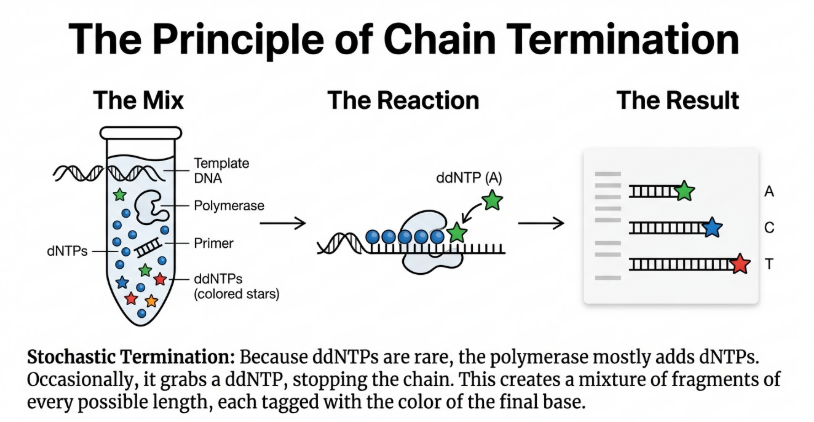
The mechanism relies on the competitive incorporation of standard deoxynucleotide triphosphates (dNTPs) and modified dideoxynucleotide triphosphates (ddNTPs). The critical differentiator is the chemical structure of the 3′ end.
| Feature | Deoxynucleotide Triphosphates (dNTPs) | Dideoxynucleotide Triphosphates (ddNTPs) | Molecular Consequence |
|---|---|---|---|
| Chemical Structure | Contains a 3′ hydroxyl (-OH) group. | Lacks the 3′ hydroxyl group (dideoxy). | dNTP: Continued 5′ to 3′ elongation via phosphodiester bridge. |
| Functional Role | Building block for chain elongation. | Chain-terminating agent. | ddNTP: Immediate stoichiometric termination. |
| Impact on Synthesis | Enables DNA polymerase to form a phosphodiester bond with the next base. | Prevents phosphodiester bond formation, halting synthesis. | Result: Generates fragments of varying lengths for resolution. |

The Step-by-Step Reaction Process
1. Thermal Denaturation: The double-stranded DNA (dsDNA) template is heated to separate it into two single strands.
2. Primer Annealing: A specific oligonucleotide primer binds to a known sequence adjacent to the target region.
3. Polymerase-Driven Extension: DNA polymerase synthesizes a complementary strand by adding dNTPs.
4. Random Incorporation of ddNTPs: Fluorescently or radioactively labeled ddNTPs are present at a specific ratio. When a ddNTP is randomly incorporated, synthesis stops.
5. Chain Termination and Fragment Generation: This results in a stochastic collection of fragments, each ending in a labeled base corresponding to the termination site.
3. Technological Evolution: From Slab Gels to Automated Capillary Electrophoresis
The evolution of Sanger sequencing reflects a shift from labor-intensive manual protocols to “sequencing factories.” In the early 1990s, the TIGR team and researchers like Venter and Sinsheimer transformed the landscape. Assembling the 1.8 Mb Haemophilus influenzae genome was once a “computational nightmare” requiring the assembly of 25,000 fragments; today, automation has streamlined this into a factory-scale operation.

Contrasting “Classical” vs. “Modern” Sanger Sequencing
• Classical Method: Required four separate reaction tubes, radioactive isotopes (32P,35S,33P), and manual polyacrylamide slab gels. These gels were notoriously slow and laborious, often suffering from base-paired loops of ssDNA that hindered band resolution.
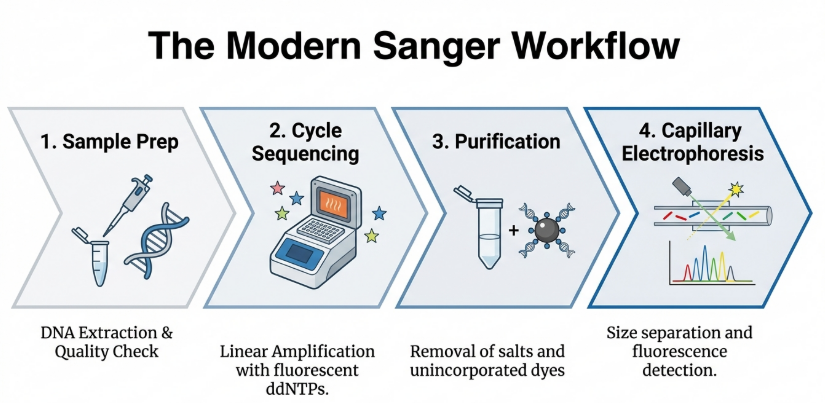
• Modern (Dye-Terminator) Method: Employs single-tube reactions with four-color fluorescent labeling. Automated Capillary Electrophoresis (CE) uses thin glass capillaries filled with polymer, allowing for laser-based fragment detection and computer-driven “base calling.”
This integration of lasers and liquid-handling platforms allows a stand-alone 96-capillary instrument to produce approximately 0.5 Mb of data per day. While automation provides the horsepower for high-throughput discovery, the validity of the output remains entirely tethered to the chemical purity of the input.
4. Operational Protocols: Sample Preparation and Quality Standards
Diagnostic accuracy is fundamentally limited by the quality of the input material. One must enforce strict adherence to the AAVLD Guidelines for Sequence Analysis.
Guidelines for Template Submission
• Purity Ratios: Spectrophotometric analysis must show a 260/280 nm ratio of ≥ 1.8. The 260/230 nm ratio should ideally be 2.0–2.2 to confirm the absence of carbohydrates, phenol, or salts.
• Purification: Unincorporated dNTPs and primers must be removed using bead-based, column-based, or enzymatic methods.
• Biological Bias Awareness: Senior biotechnologists must recognize that Sanger relies on E. coli cloning, which inherently struggles with centromeres and heterochromatic regions due to replication incompatibility.


Strategies for the “Short Fragment” Challenge
Sequencing amplicons <100 bp (common in rtPCR) is technically difficult due to poor quality near the primer-binding site. We utilize the following strategies:
1. M13 Tagging: Adding M13 sequences to primers to extend the lead-in sequence.
2. Cloning: Inserting fragments into a plasmid vector.
3. Instrumentation Software Modification: Adjusting hardware and software parameters specifically for short targets to improve the outcome.
5. Data Integrity: Interpreting Chromatograms and Quality Scores
The reliability of a diagnostic result depends on a combination of automated bioinformatics and manual review.
Non-Negotiable Quality Metrics
Phred score of Q20 (99.9% accuracy) as the non-negotiable threshold for diagnostic base calling should be mandated. Scores below this are considered unreliable and must be addressed via manual “trimming” of low-quality ends (typically the first 15–40 and last 100+ bases).
Laboratory Protocols for Data Review
• Overlapping Peaks: Indicates mixed genotypes (e.g., dual infections) or non-specific primer binding.
• Background Noise: Secondary peaks must be <20% of the main peak; otherwise, the sequence must be discarded.
• Indel Management: When assembly of forward and reverse sequences results in insertions or deletions (indels) in only one strand, re-sequencing of that strand is required.
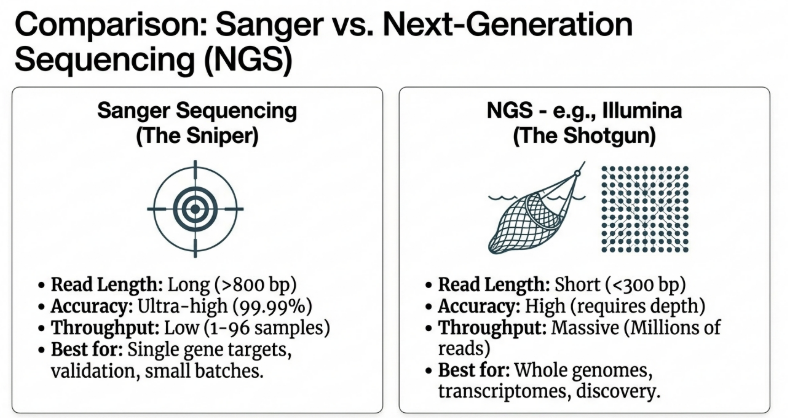
6. Strategic Comparison: Sanger Sequencing vs. Next-Generation Sequencing (NGS)
While NGS offers volume, Sanger offers certain depth.
| Dimension | Sanger Sequencing | Next-Generation Sequencing (NGS) |
|---|---|---|
| Throughput | Sequential (1–96 samples). | Massively parallel (millions of fragments). |
| Read Length | Long (800–1,000 bp). | Shorter (50–300 bp typical). |
| Accuracy | 99.99% (Single-pass “Gold Standard”). | Higher raw error rates; accuracy achieved through high coverage/redundancy. |
| Cost-Efficiency | High for single genes/clones. | High for whole genomes/large panels. |
| Bioinformatics | Low; manual trace review. | High; requires massive computational infrastructure. |
The following table highlights the strategic differentiators between these methodologies:
| Feature | Sanger Sequencing | Next-Generation Sequencing (NGS) |
|---|---|---|
| Sequencing Principle | Chain termination (dideoxy) | Massively parallel cyclic array |
| Read Length | Direct reflection of the template | Generally shorter (platform-dependent) |
| Error Rate | Very low (99.99% base accuracy) | Higher; requires repeated coverage/stats |
| Parallelization | Sequential (one strand at a time) | Massively parallel (simultaneous) |
| Analysis Basis | Direct reflection of template | Complex signal deconvolution |
Sanger remains the essential Validation Layer for NGS findings, particularly in clinical panels where “massively parallel” data must be confirmed with 99.99% single-molecule certainty.
7. Modern Applications: Clinical Diagnostics and Public Health Surveillance
Sanger sequencing is pivotal for identifying emerging pathogens and maintaining public health standards.
• Public Health Surveillance: Critical for rapid sequencing of the SARS-CoV-2 spike protein (S-gene) and tracking norovirus via the CDC’s CaliciNet.
• Veterinary Diagnostics: Differentiating field vs. vaccine strains and providing the sequence data for autogenous vaccine production.
• Analytical Stack: We recommend the use of NCBI Primer-BLAST for design, and software such as MEGA, ClustalW, or Muscle for phylogenetic analysis.
• Diagnostic Rule of Thumb: When blasting short amplicons, you must match at least 17 base pairs (5–6 amino acids) to verified reference strains to confirm the identity of a disease agent.

8. Conclusion: The Future of the Gold Standard
Sanger sequencing’s 99.99% accuracy ensures its continued relevance as the technical anchor for genomics. By adhering to rigorous ISO/AAVLD standards and maintaining a Phred Q20 baseline, the integrity of the data that informs global health policies is maintained.
Image Summary


Questions/Answers
1. Sanger sequencing basics.
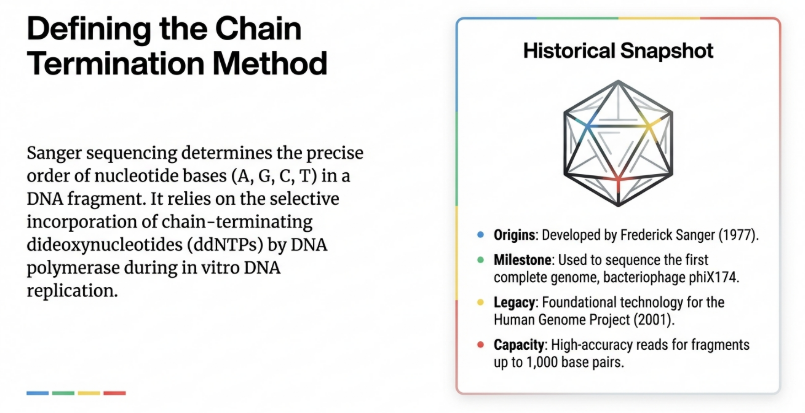
Sanger sequencing, developed by Frederick Sanger in 1977, is a method used to determine the exact identity and order of the four nucleotide bases (adenine, guanine, cytosine, and thymine) in a segment of DNA. Often called the “gold standard” of sequencing technology, it is prized for its 99.99% base accuracy and its ability to generate relatively long “reads” of up to 800–1,000 base pairs.
The Core Principle: “Chain Termination”
The most important concept for a beginner to understand is that Sanger sequencing is a “chain-termination” method. To sequence DNA, scientists mimic the natural process of DNA replication in a test tube, but they add a “stop signal” that randomly halts the process.
• Standard Ingredients (dNTPs): Normal DNA replication uses deoxynucleotide triphosphates (dNTPs) as the building blocks to grow a new DNA strand.
• The Stop Signal (ddNTPs): Sanger introduced specialized molecules called dideoxynucleotide triphosphates (ddNTPs). These molecules are missing a specific oxygen atom (a 3′ hydroxyl group) that is required to link to the next nucleotide in a chain.
• The Result: When DNA polymerase (the enzyme that builds DNA) randomly grabs a ddNTP instead of a normal dNTP, it can no longer add any more bases, and the extension of that specific strand stops.
The Step-by-Step Workflow
1. Preparation and Denaturation: The double-stranded DNA target is heated to separate it into two single strands.
2. Primer Annealing: A short piece of DNA called a primer is attached to a known sequence right next to the area you want to sequence, serving as a starting point for the new strand.
3. Extension and Random Termination: DNA polymerase begins building new strands starting from the primer. Because the reaction contains a mixture of normal building blocks (dNTPs) and a small amount of “stop signals” (ddNTPs), the polymerase will eventually incorporate a ddNTP by chance. This creates a collection of DNA fragments of every possible length, each ending with a labeled “stop signal”.
4. Separation (Electrophoresis): These fragments are pushed through a very thin tube called a capillary filled with a gel polymer. Shorter fragments move faster than longer ones, effectively sorting the fragments by size with single-nucleotide resolution.
5. Detection and Base Calling: As fragments reach the end of the capillary, a laser excites a fluorescent label attached to the “stop signal” nucleotide. Each of the four bases (A, G, C, T) is tagged with a different color. A computer records these colors in order, producing a chromatogram (a graph of colored peaks) that reveals the DNA sequence.
Key Strengths and Limitations
• High Accuracy: It is extremely reliable, making it the preferred method for verifying results from newer, higher-speed technologies like Next-Generation Sequencing (NGS).
• Targeted Use: It is cost-efficient for sequencing individual genes or small DNA fragments rather than entire genomes.
• Initial “Blind Spot”: The first 15–40 bases are often low quality because of where the primer binds to the DNA.
• Distance Limit: The technology typically struggles to distinguish single-base differences in segments longer than 900–1,000 base pairs.
2. How does Sanger sequencing compare to next-generation sequencing methods?
Sanger sequencing and next-generation sequencing (NGS) differ primarily in their throughput, cost-efficiency at scale, and read lengths, though they often serve complementary roles in modern genomics.
Core Methodological Differences
• Parallelization: Sanger sequencing is a sequential method where only one DNA strand or a single reaction is processed at a time. In contrast, NGS utilizes “massively parallel” or “cyclic array” sequencing, which allows for the simultaneous sequencing of millions of different DNA fragments in a single run.
• Speed and Throughput: Because it is sequential, Sanger is relatively slow and suited for small DNA segments. NGS is significantly faster for large-scale projects, with some platforms producing up to 500 megabases a day, making it at least a thousand times more efficient than standard automated Sanger machines.
• Detection: Modern Sanger sequencing typically uses capillary electrophoresis to separate fluorescently labeled fragments by size. NGS platforms use various methods depending on the technology, such as pyrosequencing or measuring physical changes in real-time.
Performance Comparisons
• Accuracy: Sanger sequencing is the “gold standard” for accuracy, maintaining a 99.99% base accuracy rate. While individual NGS reads often have a higher error rate, the technology compensates for this through high sequence coverage (reading the same area many times) and statistical methods to correct errors.
• Read Length: Sanger sequencing excels in read length, typically reaching 800–1,000 base pairs. NGS read lengths are generally shorter, often ranging from 30 to 300 base pairs on popular platforms like Illumina, though some specialized “long-read” NGS technologies can reach several kilobases.
• Cost Efficiency: For large-scale projects like whole-genome sequencing, NGS is vastly more economical. Sanger sequencing remains cost-efficient for small-scale projects, such as sequencing single genes, site-directed mutagenesis, or cloned inserts.
Key Applications and Synergy
• Verification: Because of its superior accuracy, Sanger sequencing is frequently used to validate results obtained through NGS or to verify unusual laboratory findings.
• Clinical and Diagnostic Use: NGS is increasingly used for large-scale clinical panels, such as identifying mutations in muscular dystrophy or detecting fetal aneuploidies from maternal blood. Sanger sequencing remains vital for confirmatory testing and for sequencing exons with high repetitive content or high GC regions that are difficult for NGS to capture.
• Limitations: Sanger sequencing suffers from “biological bias” when cloning is required (some DNA parts are unclonable in bacteria) and typically has low-quality data in the first 15–40 bases. NGS requires sophisticated bioinformatics and high computing power to assemble and interpret the massive amount of data generated.
Comparison Summary
| Feature | Sanger Sequencing | Next-Generation Sequencing (NGS) |
|---|---|---|
| Throughput | Low (Sequential) | High (Massively Parallel) |
| Accuracy | 99.99% (Gold Standard) | Lower per-read; high in assembly |
| Read Length | 800–1,000 bp | Generally shorter (30–300 bp) |
| Best For | Single genes, validation | Whole genomes, large panels |
| Data Analysis | Straightforward | Complex; requires bioinformatics |
3. What causes the low-quality ‘blind spot’ in the first bases?
The low-quality “blind spot” typically found at the beginning of a Sanger sequence is primarily caused by primer binding.
Detailed insights into this phenomenon include:
• Proximity to Binding Site: The unreadable or low-quality areas are typically located adjacent to the primer-binding sites. Because the primer serves as the starting point for DNA synthesis, the regions immediately following it often produce unreliable data.
• Affected Range: This “blind spot” generally encompasses the first 15–40 base pairs (bp) of the sequence.
• Data Management: Because these initial bases are unreliable, they are typically “trimmed” or removed from the final analysis. Modern sequence-analysis software often performs this trimming automatically by scoring the quality of each peak and filtering out these low-quality regions at the ends of the sequence.
• Challenges with Short Targets: This limitation makes sequencing very short DNA fragments (less than 100 bp) particularly challenging. To overcome this, researchers may use an “outer primer set” to amplify a larger segment, ensuring the specific target region of interest is far enough away from the primer-binding site to be read clearly.
4. Why do overlapping peaks appearing in a chromatogram mean ‘mixed sequences’?
In a standard Sanger sequencing result, a high-quality chromatogram (also called an electropherogram) should show distinct, individual peaks with no overlap, where each peak represents a single nucleotide base at a specific position. When overlapping peaks appear, it indicates that the sequencing equipment has detected more than one DNA sequence at the same time, leading to the interpretation of “mixed sequences”.
This phenomenon occurs for several biological and technical reasons:
• Dual Infections or Multiple Genotypes: Overlapping peaks are often a sign that the sample contains two or more closely related genotypes or strains of a pathogen. For example, in veterinary diagnostics, this can indicate a dual infection where two different versions of a virus are present in the same tissue.
• Genetic Variation (SNPs): In humans or animals, overlapping peaks may represent a heterozygous single-nucleotide polymorphism (SNP). This happens when an individual has different alleles at the same location on matching chromosomes, resulting in two different bases being read simultaneously.
• Nonspecific Primer Binding: If the sequencing primer binds to more than one location on the DNA template or to other genomic material in the sample, it will start building multiple different sequences at once. This creates a jumble of overlapping peaks because the laser detects different colored fluorescent labels at the same position.
• High Background Noise: Sometimes, secondary lower peaks appear at the bottom of the chromatogram. While a small amount of “noise” is expected, if these secondary peaks reach a height greater than 20% of the main peak, the sequence is officially considered mixed and unreliable.
If overlapping peaks are caused by technical errors like nonspecific binding, the laboratory guidelines typically recommend repeating the amplification and sequencing steps to try and obtain a single, clear result.
5. What causes the high-quality peak height differences in chromatograms?
In a Sanger sequencing chromatogram (or electropherogram), differences in peak heights and shapes are primarily caused by dye-terminator effects and the concentration of reagents. Even in high-quality sequences, peaks are rarely perfectly uniform due to the following factors:
1. Variability in ddNTP Incorporation
The most common cause of unequal peak heights is the difference in how DNA polymerase incorporates the four different dye-labeled dideoxynucleotides (ddNTPs).
• Chemical Bias: In dye-terminator sequencing, each of the four chain-terminating ddNTPs is labeled with a different fluorescent dye. The DNA polymerase enzyme does not incorporate these modified molecules with equal efficiency.
• Resulting Trace: These “dye effects” lead to inconsistent signal strengths, which the sequencing software interprets as unequal peak heights and shapes. Modern sequencing systems attempt to fix this by using modified DNA polymerases and optimized dyes specifically engineered to minimize this variability.
2. ddNTP Concentration and Sequence Position
The relative height of peaks across the length of the read is heavily influenced by the concentration of ddNTPs in the reaction mix.
• Early vs. Late Termination: If the concentration of ddNTPs is too high, the polymerase is more likely to incorporate a “stop signal” early in the process. This results in a higher density of short fragments, causing the peaks at the beginning of the sequence (near the 5′ end) to be much taller than those at the end.
• Signal Decay: Conversely, if the concentration is too low, there may not be enough termination events to produce a strong signal for the later bases, leading to shorter, lower-quality peaks as the read progresses.
3. Template and Primer Ratios
The overall intensity (or “weight”) of the peaks is also determined by the initial quantification and ratio of the DNA template and the primers.
• Successful Reactions: For a high-quality result with clear peaks, there must be a specific weight of the template relative to its length (e.g., 10–15 ng for a 500–1,000 bp amplicon) and a precise amount of primer (typically 8 pmol).
• Quantification Errors: If the DNA or primer concentration is suboptimal, the resulting chromatogram may show weak peaks that are difficult to distinguish from background noise.
4. Sequence Context and Secondary Structures
The physical properties of the DNA template itself can affect peak quality. DNA secondary structures or regions with high GC content can interfere with the fidelity of the polymerase, sometimes causing localized variations in peak height or resolution. While Sanger sequencing is the “gold standard,” it still faces challenges in resolving peaks clearly in highly repetitive or structurally complex regions.
6. What steps can a lab take to fix a mixed sequence result?
To fix a mixed sequence result in Sanger sequencing, which is characterized by overlapping peaks in a chromatogram, laboratories typically employ a step-by-step troubleshooting approach focusing on amplicon preparation, primer specificity, and purification,.
1. Repeat the Amplification and Sequencing
The most immediate step when a mixed sequence is detected, particularly if it results from nonspecific primer binding, is to repeat both the amplification and sequencing steps. Experienced laboratories note that up to 10% of sequencing submissions may require repetition to achieve satisfactory quality.
2. Refine Amplicon Isolation and Generation
If the mixed result is due to the presence of multiple DNA products (multiple “bands”), the lab must isolate the specific target of interest.
• Gel Purification: If electrophoresis reveals more than one product, the unique band of interest should be isolated using physical methods (like electrophoresis into a trough), enzymatic methods (agarose digestion), or specialized columns and magnetic beads.
• Single Primer Pairs: While it is theoretically possible to sequence from a multiplex PCR reaction, this often leads to increased complexity and primer interference. It is recommended to repeat the PCR reaction using one specific pair of primers to resolve the issue.
• Re-amplification: If the original template concentration is too low to produce a clean signal, the lab can re-amplify the single target from a diluted version of the original multiplex PCR amplicons.
3. Optimize Primer Design and Ratios
Mixed sequences are often the result of the primer binding to more than one location or the use of improper reagent ratios,.
• Avoid Degenerate Primers: Laboratories should avoid using degenerate primers whenever possible, as they frequently cause problems in priming the sequencing reaction.
• Prevent Mispriming: Using primer design tools can help ensure appropriate melting temperatures and the avoidance of secondary primer binding sites, mispriming, or the formation of hairpins and dimers.
• Adjust Ratios: Troubleshooting may involve adjusting the ratio of primer to template to ensure the sequencing reaction proceeds optimally.
4. Enhance Purification Protocols
Residual impurities from the PCR process can interfere with the sequencing read.
• Eliminate Contaminants: Labs should modify or strictly follow NA-purification protocols to eliminate unincorporated dNTPs, polymerase enzymes, unbound primers, and salts,.
• Verify Purity: Using spectrophotometric analysis to ensure a 260 nm/280 nm absorbance ratio of 1.8 or higher can help confirm the purity of the DNA sample before sequencing.
5. Manual Data Inspection
In some cases, a “mixed” reading is simply the result of software automated “base calling” being unable to distinguish peaks,.
• Visual Review: A human operator should manually inspect the chromatogram; ambiguous bases labeled as “N” by the software can often be clarified through visual inspection,.
• Noise Assessment: Secondary peaks (background noise) are considered acceptable only if the peak height is less than 20% of the main sequence peak. If the noise exceeds this threshold, the sequence is unreliable and must be discarded or repeated.
7. What steps can a lab take to fix a mixed sequence result?
When a laboratory detects a mixed sequence result—characterized by overlapping peaks in a chromatogram—it indicates that multiple DNA sequences are being read simultaneously. To resolve this and obtain a clean, single-sequence result, laboratories can take the following technical and analytical steps:
1. Repeat the Amplification and Sequencing
The most direct response to a mixed sequence, particularly when nonspecific primer binding is suspected, is to repeat both the amplification and the sequencing steps. If the quality problems persist, laboratories often investigate the process through a step-by-step troubleshooting approach, which may include:
• Adjusting the ratio of the sequencing primer to the DNA template.
• Modifying nucleic acid purification protocols to eliminate impurities or competing fragments.
• Performing a repeatability assessment by sequencing a known target to verify if the issue is with the specific sample or the automated process itself.
2. Isolate a Single Target “Band”
A common cause of mixed sequences is a PCR reaction that produces more than one product. For successful Sanger sequencing, the sample should ideally contain a single, homogeneous product.
• Gel Purification: If multiple products are formed, the laboratory should use gel electrophoresis to visualize the products as “bands” and then isolate the specific band of interest.
• Isolation Methods: This isolation can be achieved through physical methods (like electrophoresis into a preformed trough), enzymatic methods (agarose digestion), or using specialized columns and magnetic beads.
3. Move from Multiplex to Specific PCR
While it is technically possible to sequence a single amplicon from a multiplex PCR, this practice is not recommended for diagnostic use because it is prone to primer interference and increased analysis complexity.
• Single Primer Pairs: Labs should resolve mixed results by repeating the PCR using only one specific pair of primers for the target of interest.
• Dilution and Re-amplification: If the original template concentration is too low, the lab can dilute the multiplex amplicons and then re-amplify just the single target to reach the desired concentration for a clean read.
4. Optimize Sample and Primer Quality
Poorly designed primers can bind to more than one location on the DNA template, causing mixed signals.
• Primer Design: Labs can use online or commercial tools to ensure primers have the appropriate melting temperature and avoid sequences with potential for secondary binding or mispriming.
• Avoid Degenerate Primers: Because degenerate primers can cause issues in the sequencing reaction, they should be avoided whenever possible to prevent mixed results.
5. Manual and Software Editing
In some cases, the “mixed” appearance is actually low-level background noise.
• Peak Height Threshold: A competing peak is generally considered acceptable if its height is less than 20% of the main target peak; if it exceeds this, the sequence must be discarded as unreliable.
• Manual Review: Some ambiguous bases (often labeled as “N” by software) can be clarified through manual inspection of the chromatogram by a trained technician, provided the overall data quality is high.
8. What is the 20% rule for background noise in chromatograms?
The 20% rule is a quality assessment standard used to determine if a Sanger sequencing result is reliable enough for interpretation. According to the sources, background noise (also known as “competing sequences”) often appears at the bottom of a chromatogram in the form of secondary peaks that sit beneath the main target sequence peaks.
Key aspects of this rule include:
• Acceptable Threshold: A secondary peak is considered acceptable only when its height is less than 20% of the height of the main sequence peak.
• Consequences of High Noise: If competing peaks reach or exceed this 20% threshold, the interference is considered too significant, resulting in a low-quality and unreliable sequence. In these instances, the sources state that the entire sequence should be discarded.
• Manual Inspection: While automated software can score peak quality, this specific rule is often applied during a manual visual inspection of the raw data. This human review is necessary to verify the quality of the sequence before it is compared to reference databases for final interpretation.
• Troubleshooting: If a sequence fails this rule, laboratories may need to investigate the cause—such as poor amplicon preparation or improper primer-to-template ratios—and repeat the sequencing process to achieve a cleaner result.
By adhering to this threshold, laboratories ensure that the final “base calling” and the resulting consensus sequence are accurate and free from significant interference.
9. Can software automatically fix these errors in the sequence?
Modern sequencing software can automatically manage and correct certain types of errors, though it operates more as a filter than a perfect “fix” for truly poor data. While software is highly efficient for large data sets, the sources emphasize that its accuracy is generally considered inferior to manual visual inspection by an experienced operator.
1. Automated Trimming and Filtering
Software is essential for identifying and removing predictably low-quality data.
• End Trimming: Programs can automatically “trim” or remove the low-quality “blind spot” typically found in the first 15–40 base pairs near the primer-binding site, as well as deteriorating data at the end of a read.
• Quality Scoring: Most programs use Phred-based algorithms to assign a quality score to every base. A score of 20 or higher usually indicates a reliable base call, while lower scores guide the software to either remove or mark questionable regions.
2. Base Calling and Ambiguity Marking
When the software encounters a signal it cannot clearly interpret, it uses a labeling system rather than an outright fix.
• The “N” Label: If quality scores are too low to distinguish between peaks, the software automatically labels the position with the letter “N” (ambiguous) instead of assigning A, G, C, or T.
• Manual Overriding: A human technician can often clarify these “N” labels by manually inspecting the raw chromatogram data, identifying peaks that the software’s algorithm missed or misinterpreted.
3. Error Correction Through Assembly
One of the most powerful “automatic” fixes occurs during the assembly stage, where multiple reads of the same DNA segment are compared.
• Agreement of Strands: When forward and reverse strands are aligned, the software looks for near-perfect agreement. This process allows for the correction of unavoidable enzymatic errors that may have occurred in one strand but not the other.
• Handling Indels: If the assembly detects insertions or deletions (indels) in only one strand, it flags the area; generally, insertions in sets of three nucleotides are considered more reliable than single-base shifts, which may indicate a quality problem rather than a biological reality.
4. Limitations of Automated “Fixing”
Software cannot salvage data that falls below certain quality thresholds.
• The 20% Threshold: If background noise (competing secondary peaks) reaches or exceeds 20% of the height of the main peak, software tools generally cannot “fix” the result; the guidelines recommend that the entire sequence be discarded as unreliable.
• Mixed Sequences: In cases of dual infections or nonspecific primer binding resulting in overlapping peaks, the software will often fail to provide a clear consensus, requiring the lab to repeat the laboratory steps rather than relying on a digital fix.
10. How do researchers effectively sequence fragments shorter than 100bp?
Sequencing DNA fragments shorter than 100 base pairs (bp) presents a significant challenge for Sanger sequencing because these small segments often fall entirely within the “blind spot” of low-quality data (typically the first 15–40 bp) created by primer binding. While Sanger sequencing is most efficient for amplicons between 100 and 800 bp, researchers use several specialized strategies to effectively capture and verify these shorter sequences.
1. The “Outer Primer” Strategy
One common approach is to use an outer primer set to amplify a larger segment of DNA that encompasses the specific short fragment of interest. By amplifying a longer region, researchers ensure that the specific target sequence is moved further away from the initial primer-binding site, allowing it to be read more clearly outside of the low-quality beginning of the sequence. This method is also particularly useful for monitoring PCR assay efficiency and performing quality control trend analysis.
2. Cloning into Vectors
Researchers can also clone the short amplicon into a plasmid vector. Once the fragment is inserted, sequencing is performed using vector-specific primers, such as M13, T7, or SP6, which bind to the known sequence of the vector itself rather than the short insert. This allows the entire target fragment to be sequenced with high accuracy because the primer-binding “blind spot” occurs within the vector’s sequence, not the target DNA.
3. M13 Tagging
Another technique involves tagging the original forward and reverse primers with M13 sequences. Following a limited number of amplification cycles (typically 15–20), these tags provide a reliable priming site for the sequencing reaction. According to the sources, this specific technique is reported to effectively provide the sequence of small amplicons approximately 50% of the time.
4. Software and Instrumentation Adjustments
When submitting short fragments, it is recommended to alert the sequencing facility or the personnel responsible for the equipment. Depending on the specific platform used, it is often possible to apply sequence-analysis modifications within the instrumentation software that are specifically designed to improve the quality of data for targets under 100 bp.
5. Verification Standards for Short Amplicons
Because short sequences yield less data, the standards for verifying them against databases are adjusted. For amplicons generated by real-time PCR (rtPCR), which are often between 50 and 150 bp, the “rule of thumb” for verification is to match at least 17 base pairs to a reference strain in a public database. This 17 bp match translates to roughly 5–6 amino acids, which is considered sufficient to verify the detection of a specific disease agent.
11. How can labs troubleshoot results with high background noise?
To troubleshoot results with high background noise—which the sources define as secondary lower peaks appearing at the bottom of a chromatogram—laboratories follow a systematic, step-by-step troubleshooting approach focusing on sample purity, primer specificity, and process verification.
The primary standard for evaluation is the 20% rule: if these secondary peaks exceed 20% of the height of the main sequence peaks, the interference is considered too high, and the entire sequence should be discarded as unreliable.
According to the sources, labs can take the following actions to resolve these issues:
1. Refine Amplicon Isolation and Generation
Background noise is often the result of the sequencing equipment detecting more than one DNA product in a single sample.
• Isolate Single Bands: For successful results, the target should ideally be a single, homogeneous product. If electrophoresis reveals multiple bands, labs should isolate the specific band of interest using gel purification, enzymatic methods (like agarose digestion), or specialized columns and magnetic beads.
• Avoid Multiplex Interference: While sequencing from a multiplex PCR is possible in theory, the sources do not recommend it for diagnostics because it is prone to primer interference and lower yields. Repeating the PCR with one specific pair of primers often resolves the noise.
• Re-amplification: If the target concentration is too low, labs can re-amplify the single target from a diluted version of the original multiplex amplicons to achieve a cleaner, more concentrated sample.
2. Enhance Purification and Purity Checks
Contaminants from the initial PCR reaction can directly interfere with the sequencing trace.
• Eliminate Residual Impurities: Purification must be performed to remove unincorporated dNTPs, polymerase enzymes, unbound primers, and salts.
• Verify Purity Ratios: Labs should use spectrophotometric analysis to ensure a 260 nm/280 nm absorbance ratio of 1.8 or higher. Additionally, measuring at 230 nm can help detect other contaminants like carbohydrates or phenol; an optimal 260 nm/230 nm ratio is between 2.0 and 2.2.
3. Optimize Primer and Reaction Parameters
Issues with how the primer binds to the DNA or the concentration of reagents can lead to competing signals.
• Prevent Mispriming: Labs use design tools to ensure primers have appropriate melting temperatures and to avoid sequences that cause secondary primer binding, hairpins, or dimers. Degenerate primers should be avoided as they frequently cause problems in the sequencing reaction.
• Adjust Reagent Ratios: Troubleshooting may involve adjusting the specific ratio of primer to template to ensure optimal incorporation of labels and termination.
4. Process and Contamination Controls
If the cause is not immediately obvious, labs investigate the automated process itself.
• Repeatability Assessment: Labs may submit a previously sequenced known target to compare results; this helps determine if the noise is unique to the current sample or is a systemic problem with the sequencing equipment.
• Negative Controls: Periodically submitting a “no amplicon” buffer as a negative control helps monitor for contamination issues that may have occurred during the amplification steps.
5. Manual Data Management
While software can automatically “trim” low-quality data at the ends of a sequence, it is often less accurate than a human operator at distinguishing noise from real data. Experienced technicians can manually inspect chromatograms to clarify ambiguous bases (labeled as “N”) if the overall quality is high and the noise remains below the acceptable 20% threshold.
References
Crossley, B. M., Bai, J., Glaser, A., Maes, R., Porter, E., Killian, M. L., Clement, T., & Toohey-Kurth, K. (2020). Guidelines for Sanger sequencing and molecular assay monitoring. Journal of Veterinary Diagnostic Investigation, 32(6), 767–775. https://doi.org/10.1177/1040638720905833
Men, A., Wilson, P., Siemering, K., & Forrest, S. (2008). Sanger DNA Sequencing. In M. Janitz (Ed.), Next-Generation Genome Sequencing: Towards Personalized Medicine. (pp. 3–11). Wiley-Blackwell.
Valencia, C. A., Pervaiz, M. A., Husami, A., Qian, Y., & Zhang, K. (2013). Sanger Sequencing Principles, History, and Landmarks (pp. 3–11). https://doi.org/10.1007/978-1-4614-9032-6_1
https://www.thermofisher.com/np/en/home/life-science/sequencing/sequencing-learning-center/capillary-electrophoresis-information/what-is-sanger-sequencing.html
https://www.cd-genomics.com/blog/sanger-sequencing-introduction-principle-and-protocol/
https://en.wikipedia.org/wiki/Sanger_sequencing
Related posts:
 Earthworm Gut Bacteria Offers Sustainable Solution Against Rice Bacterial Blight
 ढलौटे फोहोरको बायोचार र Trichoderma afroharzianum सँग मिलेर टमाटरमा हुने जराको रोग नियन्त्रण
 Red Sea Streptomyces Reveals New Bioactive Metabolites through Genomic and Metabolomic Integration
 Breakthrough Discovery: New Bacterium Pseudochrobactrum saccharolyticum Efficiently Removes Manganese from Polluted Environments
 Unraveling the Code: A Guide to Eukaryotic Transcription

