1. Introduction to the Spatial Molecular Revolution
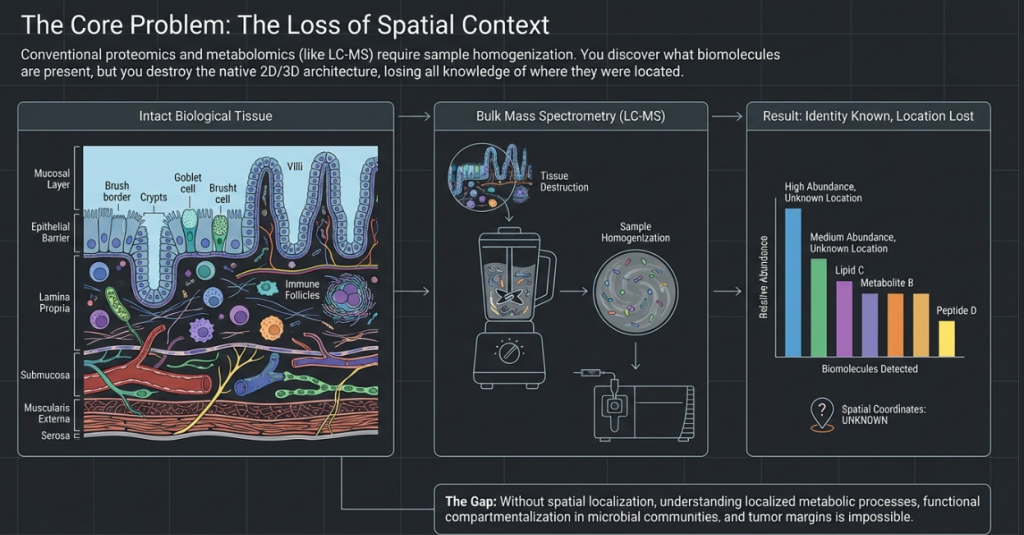
MALDI-IMS (Matrix-Assisted Laser Desorption/Ionization Imaging Mass Spectrometry) represents a transformative bridge between traditional histology and deep molecular analysis. By integrating the analytical power of mass spectrometry with the visual context of microscopy, strategic adoption of this technology enables the high-resolution mapping of metabolites, lipids, peptides, and proteins directly from tissue sections. Unlike traditional methods that require tissue homogenization—which results in the total loss of cellular localization—spatial proteomics via MALDI-IMS preserves the biological “map,” allowing researchers to see exactly where specific molecules reside within the complex architecture of a tissue. This capability has elevated molecular histology from a purely morphological observation to a high-dimensional, data-rich exploration of disease and biology.
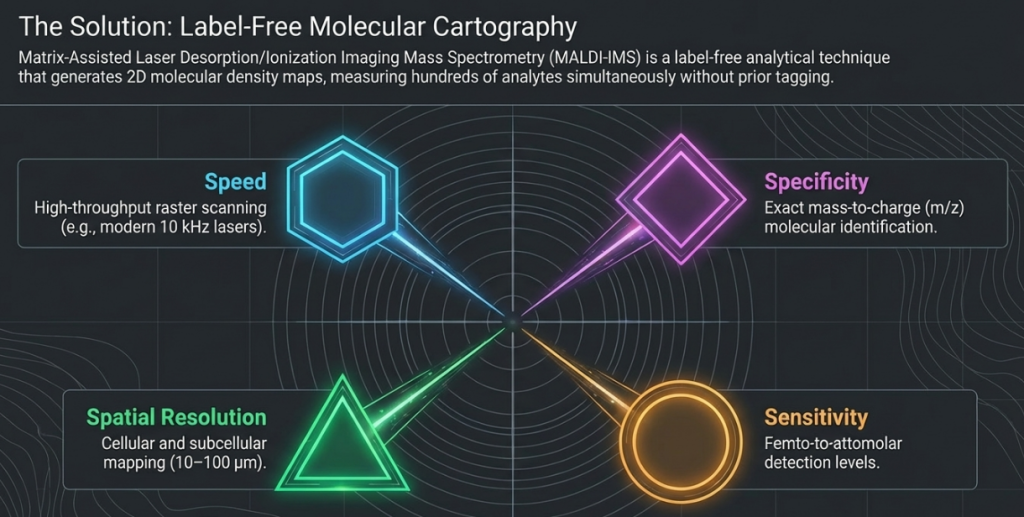
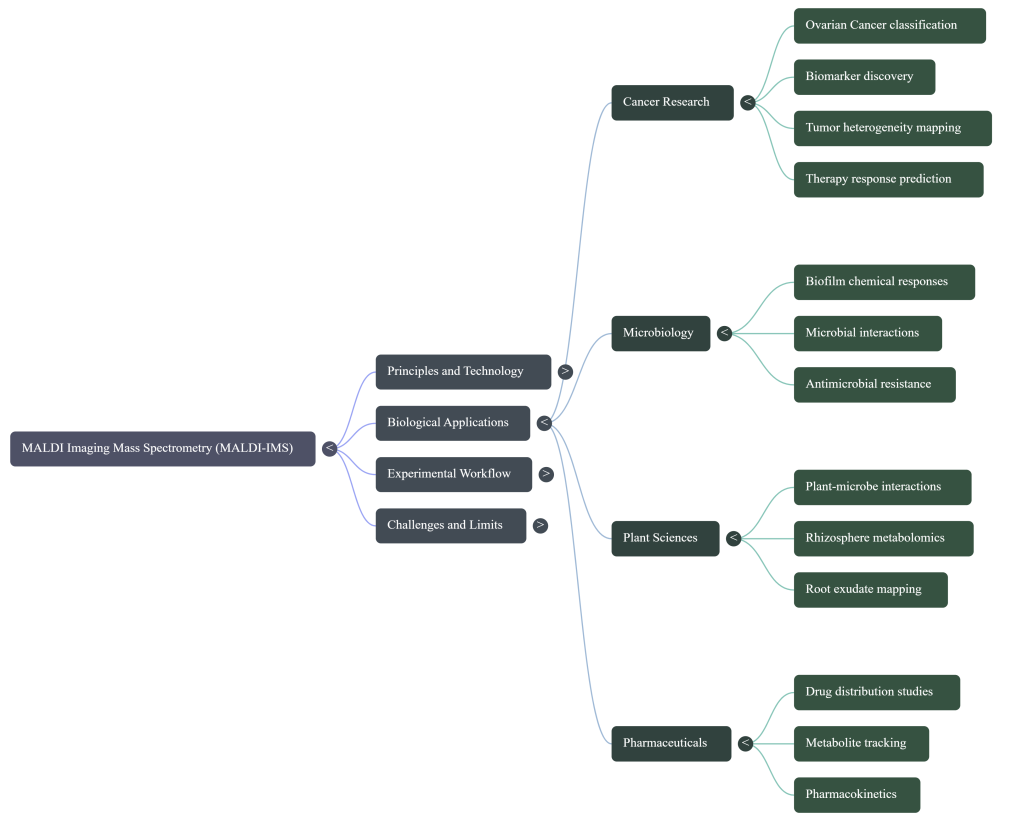
From a clinical and agricultural strategy perspective, this technology transforms tissue-based research by enabling label-free, multiplexed analysis of hundreds to thousands of molecules simultaneously. It removes the prerequisite for prior knowledge of tissue composition or the availability of specific antibodies, making it an invaluable tool for discovery. By linking morphology to deep molecular signatures, MALDI-IMS provides a holistic understanding of biological systems, from the intricacies of human carcinomas to the hidden interactions within the plant microbiome.
Key Takeaway: The Power of Label-Free Multiplexing
- Label-Free: Unlike immunohistochemistry (IHC), which requires specific antibodies or fluorescent tags, MSI identifies molecules based on their inherent mass. No prior knowledge of the tissue composition is required.
- Multiplexed: MSI allows for the simultaneous detection of hundreds to thousands of distinct molecular species in a single experiment, providing a holistic “snapshot” of the biological state rather than focusing on a single target.
- Spatial Proteomics: It preserves the crucial spatial context, showing exactly where molecular signatures—such as biomarkers or drug metabolites—reside within the cellular landscape.
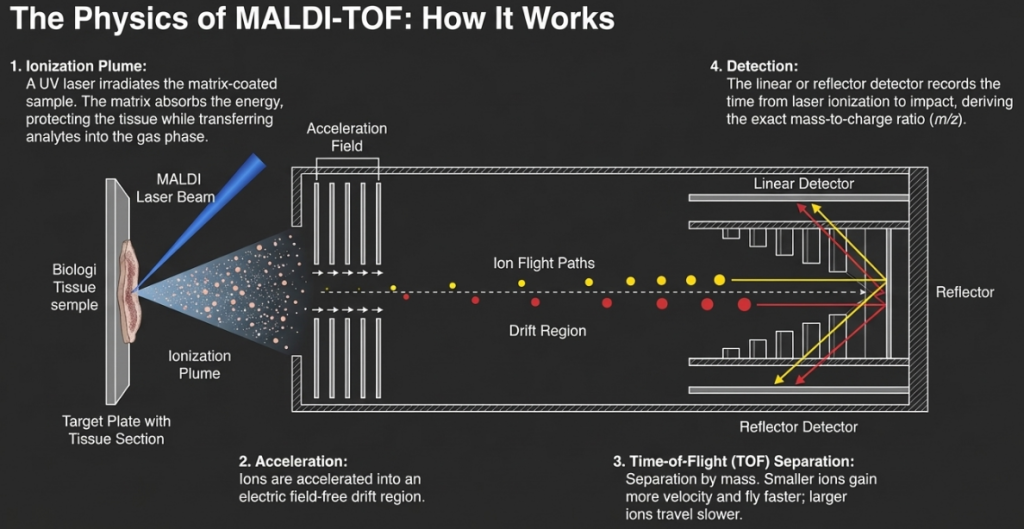
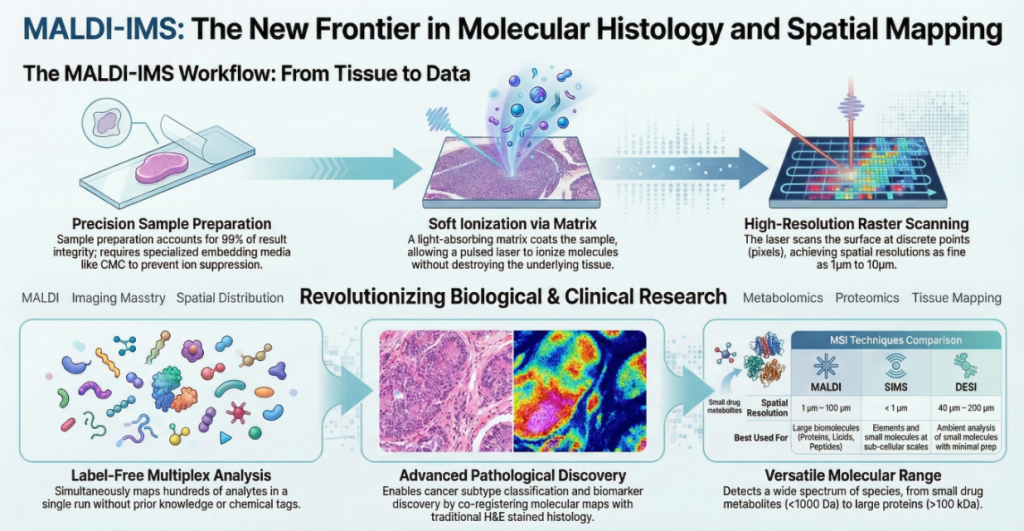
To transform a physical specimen into these complex molecular maps, we must navigate a precise three-stage mechanical workflow: ion generation, mass analysis, and detection.
2. Principles and Technical Architecture of MALDI-IMS
The strategic advantage of the MALDI process (desorption/ionization) lies in its unique mechanism of maintaining tissue integrity. During analysis, a UV laser targets a matrix layer applied to the tissue surface. Because the laser interacts primarily with this matrix, the underlying tissue remains largely intact. This allows for subsequent histological examination—such as H&E or immunohistochemistry (IHC) staining—on the very same section, facilitating the perfect coregistration of molecular patterns with cellular morphology.
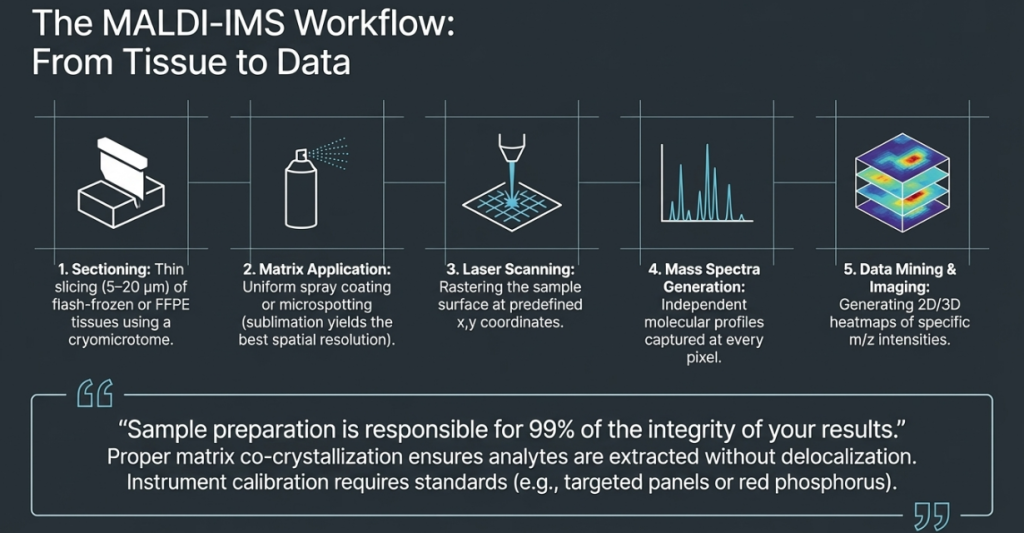
The workflow begins with the application of a chemical matrix to a thin tissue section. This matrix extracts analytes and aids their desorption into the gas phase. A UV laser then raster-scans the sample at predefined intervals, generating a discrete mass spectrum for every measuring spot (pixel). Software then reconstructs these signals into color-coded intensity maps.
Technical Specifications: MALDI-TOF vs. MALDI-FT-ICR
The choice of mass analyzer dictates the depth of molecular insight, particularly regarding resolution and sensitivity:
| Feature | MALDI-TOF (Time-of-Flight) | MALDI-FT-ICR (Fourier Transform) |
|---|---|---|
| Mass Accuracy | 20–200 ppm | 1–2 ppm |
| Mass Resolution | 5,000 – 20,000 | >100,000 |
| Mass Sensitivity | ~1 fmol | ~250 amol |
| Primary Molecular Classes | Peptides and proteins (up to 110 kDa) | Low-MW compounds, metabolites, lipids |
| Tandem MS (MS/MS) | Capable (MS²) | Highly capable (MS² to MS⁴) |
Consultant Pro-Tip: While standard acquisition typically targets proteins up to 25 kDa, utilizing a ferulic acid matrix can remarkably extend signal acquisition into the 20k to 150k m/z range.
A critical feature in modern MSI is “Virtual Microdissection.” This allows researchers to define digital regions of interest (ROIs)—such as isolating a tumor nest from the surrounding stroma—and extract cell-type-specific molecular signatures without physical disruption. This provides a clear analytical advantage over liquid-based proteomics, which often masks specific effects through signal dilution.
The Three-Part Process: From Matter to Map
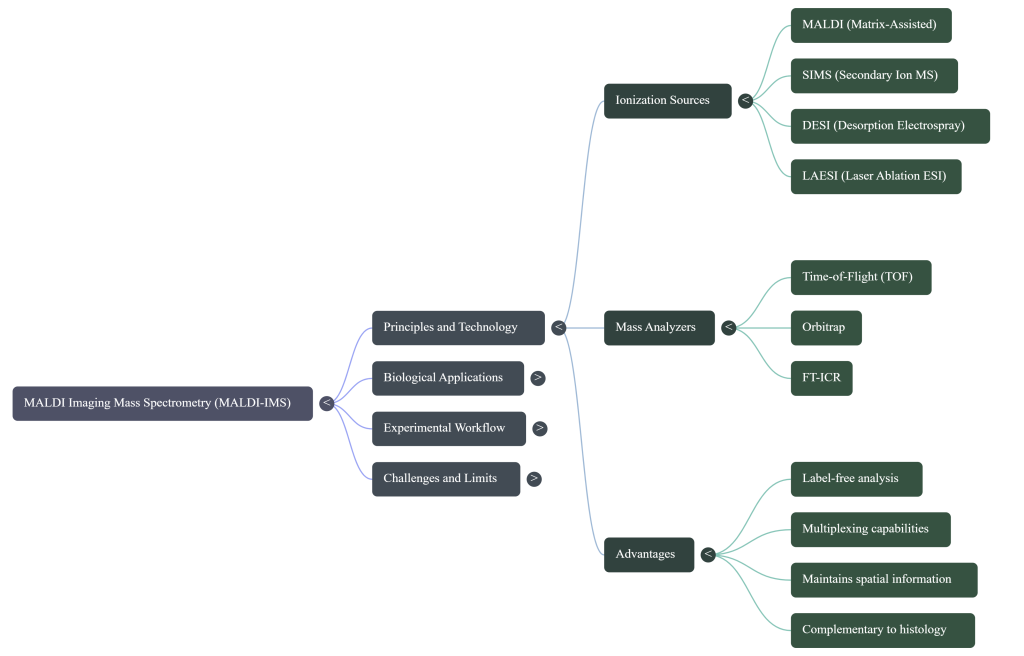
2.1 Phase 1: Ion Generation (The Spark)
The first challenge is transitioning biological material from a solid tissue section into gas-phase ions. This is achieved through specific “triggers.” In MALDI (Matrix-Assisted Laser Desorption Ionization), a chemical matrix is applied to the sample. This matrix acts as an energy absorber that facilitates soft ionization, a process where the matrix “takes the hit” from the UV laser to protect large biomolecules from fragmentation. This allows intact proteins to enter the gas phase for analysis.
| Ionization Source | Method (The Trigger) | Conditions | Mass Range (m/z) |
|---|---|---|---|
| SIMS | Primary Ion Beam | Ultra-High Vacuum | Typically <2 kDa |
| MALDI | UV Laser | Vacuum or Atmospheric | 1–25 kDa (up to 110 kDa*) |
| DESI | Charged Solvent Droplets | Atmospheric Pressure | Metabolites & Lipids |
| *With specialized detectors and matrices like ferulic acid. |
2.2 Phase 2: Mass Analysis (The Sorting)
Once ionized, the molecules are sorted by their mass-to-charge ratio (m/z). The choice of mass analyzer dictates the clarity and detail of our data.
- Time-of-Flight (ToF): These analyzers measure the time ions take to travel a vacuum tube. They are favored for their broad m/z range and high sensitivity, particularly for large proteins.
- Orbitrap & FT-ICR: These represent the pinnacle of mass resolving power. A Fourier Transform Ion Cyclotron Resonance (FT-ICR) analyzer can achieve a mass resolution of ∼400,000 and a mass accuracy of 0.2–2 ppm, allowing scientists to distinguish between two molecules with nearly identical masses.
Critical Imaging Parameters:
- Spatial (Lateral) Resolution: The “pixel size” of the image; determines the smallest structural detail visible.
- Mass Accuracy: How closely the measured m/z matches the theoretical decimal mass.
- Mass Resolution: The ability to separate two distinct molecular signals into separate peaks.
2.3 Phase 3: Detection and Visualization (The Result)
The final stage converts physical ions into digital data through a raster-scanning process.
- Raster-scanning: The ionization source moves point-by-point across the sample at a defined spatial resolution.
- Signal Conversion: At each pixel, ions hit a detector (e.g., a multichannel focal-plane camera), which converts the ion impact into an electrical signal.
- Generating a Spectrum: The software produces a unique mass spectrum for every individual pixel, representing all m/z species at that specific coordinate.
- Mapping & Overlay: Specific m/z values are assigned colors based on intensity. These “heat maps” are often overlaid onto a post-scan H&E-stained image to correlate molecular chemistry with cell morphology.
3. Comparative Methodology: Evaluating Analytical Differentiators
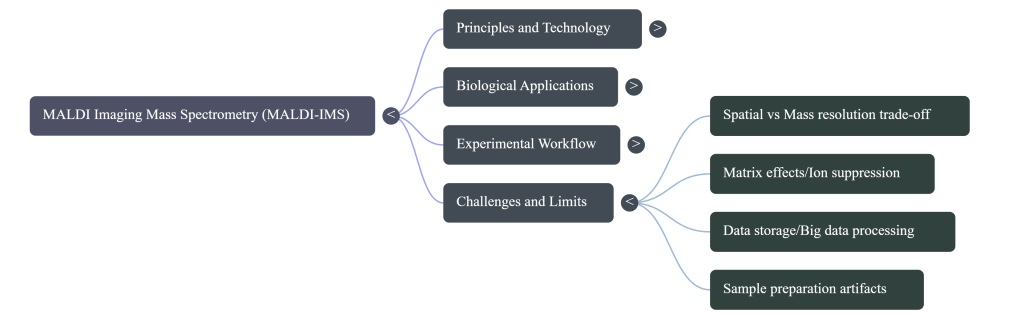
Choosing the correct MSI platform is a strategic decision dictated by the required balance of spatial resolution and molecular sensitivity. Selecting a method without considering these differentiators can lead to a lack of resolution for single-cell studies or a failure to detect high-mass prognostic proteins.
MSI Compared to Traditional Modalities
| Feature | Immunohistochemistry (IHC) | LC-MS (Liquid Chromatography) | MALDI-IMS |
|---|---|---|---|
| Spatial Resolution | Cellular/Microscopic | None (Homogenized) | 20–50 µm (Clinical Standard) |
| Multiplexing | Limited (1–4 targets) | Very High (Thousands) | High (Hundreds/Thousands) |
| Label Requirements | Requires Antibodies | Label-free or Labeled | Label-free |
| Sensitivity | High | Ultra-High | High |
The Strategic “So What?” MALDI-IMS overcomes the antibody-dependence of IHC, allowing for the study of targets like lipids or drug metabolites for which no antibodies exist. Crucially, it eliminates the loss of spatial information inherent in LC-MS. Furthermore, it can be implemented within 1–3 hours, matching the clinical timeframe required for diagnostic pathology.
Lateral Resolution Hierarchy
The lateral resolution dictates the biological scale of the inquiry. While theoretical limits are pushing lower, the standard analytical resolution in clinical practice remains 20–50 µm:
- SIMS: Sub-micrometer (<1 µm) — Ideal for subcellular imaging.
- LDPI: 2–100 µm.
- MALDI: 0.6–150 µm — The versatile standard for tissue mapping.
- DESI / LAESI: 40 – >200 µm — Optimal for rapid, ambient analysis.
4. Clinical Applications in Oncology and Diagnostic Pathology
In the era of precision medicine, the transition from morphological observation to molecular grading is essential. Heterogeneous carcinomas contain subpopulations of cells that may appear identical under a microscope but exhibit radically different treatment resistances.
Ovarian Cancer Classification and Diagnostic Urgency
Ovarian cancer is the most lethal gynecological malignancy, with 64% of cases diagnosed at advanced FIGO stages (III/IV). Current screening via CA-125 has a positive predictive value (PPV) of only 35.1%. This statistical failure has a profound human cost: two out of every three patients will be over-diagnosed and undergo unnecessary, potentially harmful invasive procedures. MALDI-IMS offers a more reliable molecular grading system, distinguishing between Type I (low grade) and Type II (high grade) tumors to drive better-informed surgical and therapeutic decisions.
Therapy Response Predictors
MALDI-IMS has identified high-value signatures such as the 7-protein signature in gastric cancer, which serves as an independent indicator of unfavorable survival. In esophageal adenocarcinoma, MSI has detected mitochondrial respiratory chain defects that predict an individual’s response to cisplatin-based chemotherapy. By identifying these phenotypic tumor subpopulations, MALDI-IMS addresses intratumoral heterogeneity, recognizing clinically relevant regions that drive progression and resistance.
5. Mapping the Microbial Biosphere: Plant-Microbe Interactions
The plant-microbe interface is an arena of extreme biological complexity where the strategic challenge lies in detecting metabolites across diverse scales—from broad microbial communities to subcellular interphases. Because microbes can be mutualistic, symbiotic, or parasitic, the ability to map where and how primary and secondary metabolites (such as nutrient uptake agents) are released is vital for understanding plant-soil feedback.
The analytical requirements for mapping these spheres are distinct:
- The Rhizosphere: A “hotspot” for bacterial growth and nutrient uptake. While microbial abundance is high, diversity is often lower than in bulk soil. MSI is required here to visualize how genera like Bacillus and Pseudomonas protect roots and facilitate mineral acquisition.
- The Endosphere: Mapping requires distinguishing between obligate endophytes (vertically transmitted and dependent on plant metabolism) and facultative endophytes (recruited from the rhizosphere or external environment).
- The Phyllosphere: A harsh environment characterized by high UV exposure and nutrient scarcity. MSI must characterize microbial resistance mechanisms, such as the production of extracellular polysaccharides for surface attachment.
- The Spermosphere: Despite its short temporal window, this sphere is critical. Interactions between soil microbes and the seed surface during early germination dictate the eventual maturation and health of the entire plant.
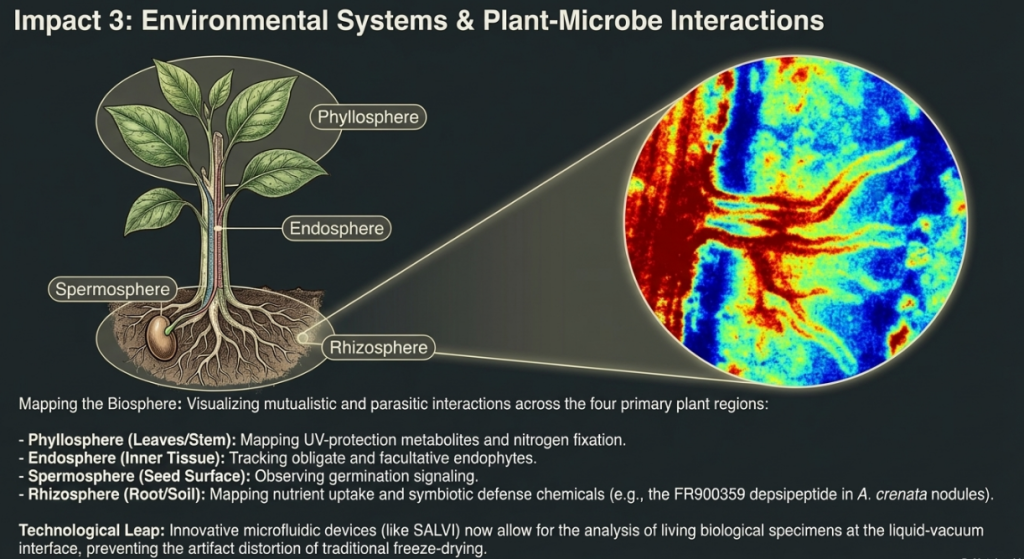
MALDI-IMS maps the distribution of biostimulants and chemoattractants in root exudates, such as malate and citrate in Arabidopsis roots. Strategically, it allows researchers to evaluate the “Antibiome”—secreted metabolites used to defend against pathogens. Technical depth in this area reveals that specific flavonoids like kaempferol (m/z– 285) and quercetin (m/z– 301) respond more aggressively against pathogenic Gram-negative species.
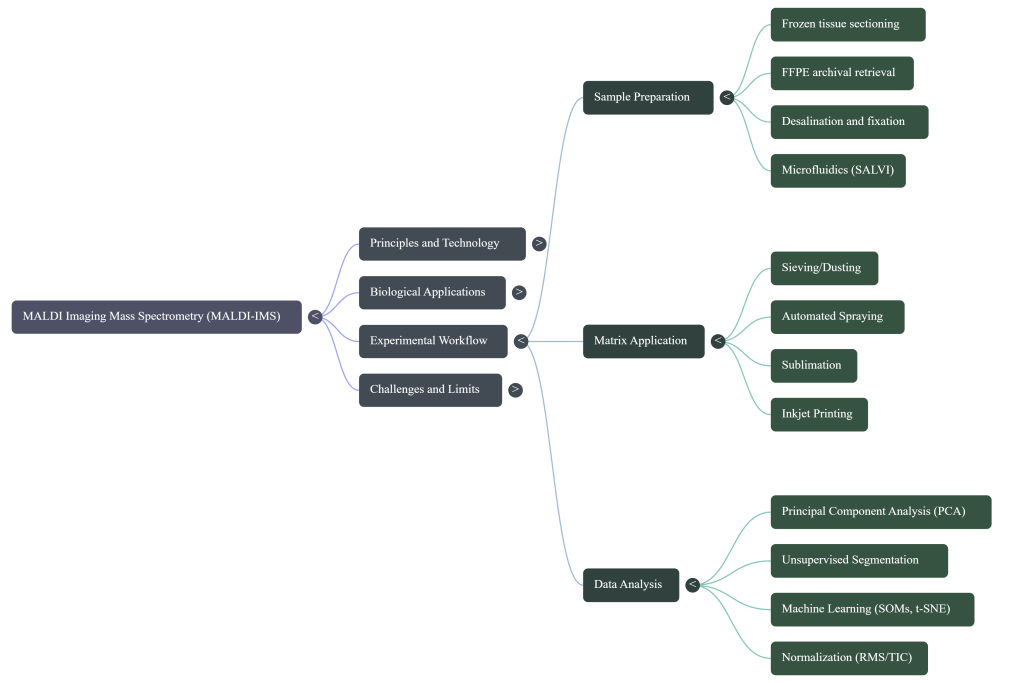
6. Methodological Rigor: Sample Preparation and Advanced Interfaces
Sample preparation is the “limiting factor” in high-value MSI. Improper handling leads to the matrix effect, where salts or chemical backgrounds mask biological signals.
The fidelity of a molecular image is dictated more by sample preparation than by the instrument’s detector sensitivity. Inadequate preservation induces molecular migration and structural collapse, rendering even the highest-resolution data scientifically invalid.
- Dehydration/Drying: Typically performed using nitrogen streams or laminar flow hoods, dehydration is common for stabilizing plant tissues. However, it risks “biofilm flaking” and morphological distortion. Furthermore, the concentration of salts during drying creates significant “matrix effects” that suppress biological signals, making it the least desirable method for high-fidelity imaging.
- Cryo-freezing/Freeze-Drying: Cryogenic methods using liquid nitrogen or Peltier cooling stages aim to trap water molecules within the sample. While effective for chemical preservation, the formation of ice crystals can distort ultrafine cellular structures. Rapid freezing is mandatory to minimize crystal growth and maintain the integrity of the bacterial-plant interface.
- Living Cell/Microfluidic Integration (SALVI): The System for Analysis at the Liquid-Vacuum Interface (SALVI) represents a strategic breakthrough for “native state” analysis. By maintaining living biofilms within a microfluidic device, researchers can analyze specimens under high-vacuum conditions (such as in ToF-SIMS). This allows for the observation of real-time metabolic pathways and cell-to-cell signaling that are otherwise lost during drying or freezing.
These protocols are essential to mitigate the introduction of technical artifacts during the imaging process.
Best Practices for Data Integrity
- Desalination: Essential to mitigate matrix effects; removing salts prevents them from masking low-abundance molecules.
- Sterilization: While autoclaving is standard, it may leave behind significant CFUs. For high-precision microbial work, dry heating at 121°C or UV/Ethanol treatment may be required to ensure data authenticity.
7. Computational Frontiers: Machine Learning and Multivariate Analysis
The management of gigabyte-sized MSI datasets requires advanced computational strategies. While traditional Multivariate Analysis (PCA, NMF) reduces dimensionality, modern Machine Learning (ML) handles non-linear patterns. The shift toward “Molecular Histology” requires advanced statistical tools to transform raw mass spectra into biological insights.
- Principal Component Analysis (PCA): By decreasing dimensionality, PCA identifies the primary directions of variation, uncovering biological features like metabolite distributions that are masked by matrix effects or chemical noise.
- Virtual Microdissection: Rather than physical dissection, researchers use software to define “Regions of Interest” (ROIs) on the digital image. This allows for the extraction of cell-type-specific signatures—for example, discriminating between the vein structures and the parenchyma/mesophyll in Fittonia argyroneura leaves without disrupting the tissue.
- Machine Learning (t-SNE, UMAP, SOMs): Tools such as Self-Organizing Maps (SOMs) and Artificial Neural Networks are essential for discriminating between complex metabolic secretions or high-weight polymers that exhibit non-linear patterns.
Machine learning has already demonstrated utility in agriculture; for instance, ML algorithms combined with MALDI-TOF can classify biological products under different thermal conditions by analyzing the intact peptidome (as seen in bovine milk studies) and provide rapid classification of antimicrobial resistance in bacterial strains.
Recent studies have shown that ML algorithms (SOMs, t-SNE, UMAP) can predict antimicrobial resistance with high precision. For instance, a study using MALDI-TOF coupled with 14 ML algorithms achieved an accuracy >0.96 specifically in the discrimination of thermal-treated bovine milk via its intact peptidome. This level of precision suggests that similar ML-integrated workflows could revolutionize rapid screening for Campylobacter or Staphylococcus resistance in clinical settings.
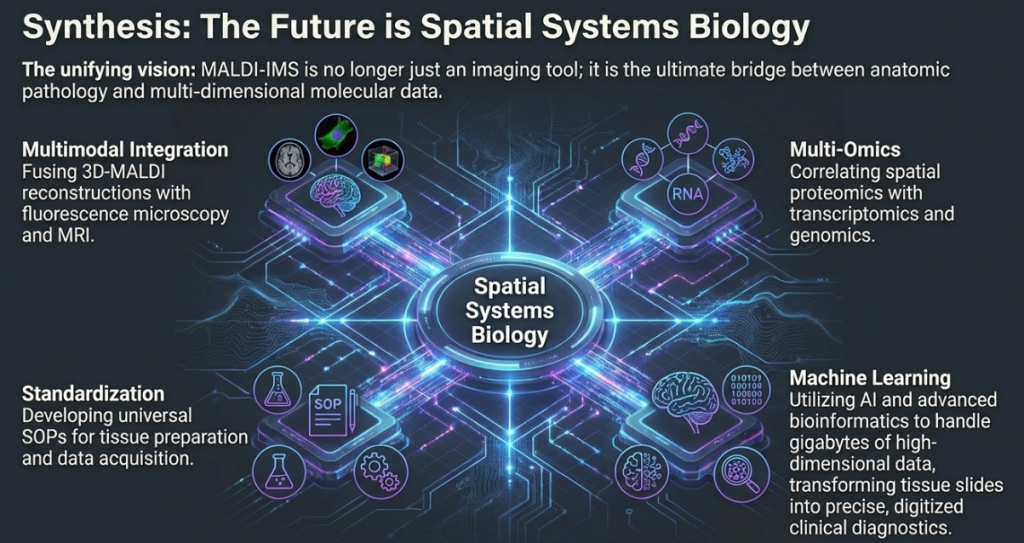
8. Conclusion: The Future of Molecular Histology
MALDI-IMS transforms the expert discipline of pathology by inextricably linking morphology to deep molecular analysis. It provides the “molecular snapshots” necessary to decode complex biological environments, from the hidden microbiomes of plants to the lethal heterogeneity of human tumors. To push the boundaries of spatial biology, researchers must move toward multimodal imaging, combining the molecular depth of MSI with the high-resolution structural data of Confocal Laser Scanning Microscopy (CLSM)—the primary current method—to ensure the future of medicine is both spatially and molecularly resolved.
Image Summary
Questions/Answers
1. Explain the role of matrix selection in identifying different biomolecules.
In Matrix-Assisted Laser Desorption/Ionization (MALDI) Mass Spectrometry Imaging, the selection of an appropriate matrix is a critical step because the chemical properties of the matrix determine which classes of biomolecules can be effectively detected and identified. The matrix is a low-molecular-weight organic molecule that is mixed with or coated over the sample.
Primary Roles of the Matrix
The matrix performs several essential functions during the ionization process:
- Energy Absorption: The matrix molecules are designed to have strong electronic absorption at the specific wavelength of the laser used in the instrument. When the laser fires, the matrix absorbs the bulk of this pulsed energy.
- Desorption and Ionization: This absorbed energy causes the matrix to rapidly transition from a solid crystal to a gaseous plume, carrying the target analyte molecules into the gas phase (desorption) and promoting their ionization in the process.
- Analyte Protection: MALDI is considered a “soft” ionization technique because the matrix acts as a buffer, preventing the direct laser energy from fragmenting large, delicate biomolecules like proteins and lipids.
Selection Based on Biomolecule Class
Different matrices have varying sensitivities and affinities for different types of biomolecules. Choosing the wrong matrix often results in poor or non-existent signals.
| Biomolecule Target | Common Matrix Selections |
|---|---|
| Proteins (>10–20 kDa) | Sinapinic acid (SA) is the standard choice for large proteins. |
| Peptides and Small Proteins (<10 kDa) | α-cyano-4-hydroxycinnamic acid (CHCA/CCA) is preferred for its efficiency with peptides and N-glycans. |
| Lipids and Metabolites (Low MW) | 2,5-Dihydroxybenzoic acid (DHB) is widely used for lipids and small metabolites, particularly in positive-ion mode. |
| Fatty Acids and Lipids (Negative-ion mode) | 9-Aminoacridine (9-AA) and 1,5-Diaminonaphthalene (1,5-DAN) are often selected for negative-mode lipidomics. |
| Oligonucleotides | Picolinic acid or Succinic acid. |
Advanced Matrix Strategies
Beyond classical organic matrices, researchers use specialized versions to enhance identification:
- Reactive Matrices: These are used for chemical derivatization to target specific functional groups (like amines or primary hydroxyl groups). This is particularly useful for detecting low-abundance neurotransmitters or steroids that are difficult to ionize using standard methods.
- Inorganic Nanomaterials: Metals (gold, silver) or carbon-based materials (graphene oxide) can serve as matrix-free platforms. Because they do not easily ionize themselves, they eliminate the “chemical noise” or background interference that organic matrices often produce in the low mass range (<1000 Da).
- Ionic Liquid Matrices (ILMs): Created by combining traditional matrices with organic bases, ILMs remain liquid at room temperature. They offer better sample homogeneity and vacuum stability compared to solid crystals, which can improve reproducibility and sensitivity for lipid and carbohydrate analysis.
Methodological Considerations
The role of the matrix is also tied to how it is applied. Robotic spotting allows for better extraction of analytes into the matrix but results in lower spatial resolution. Conversely, sublimation produces extremely small, uniform crystals that enable high-resolution imaging at the cellular level, though it may be less effective at extracting large proteins without a subsequent rehydration step.
2. How do the different MSI techniques compare in spatial resolution?
Mass Spectrometry Imaging (MSI) techniques vary significantly in their spatial resolution, ranging from nanometer-level subcellular mapping to micrometer-level whole-body tissue distribution. The achievable resolution is largely determined by the ionization source, the diameter of the probe (laser or ion beam), and sample preparation methods.
Comparison of MSI Techniques
The following table summarizes the typical spatial resolutions reported for the major MSI modalities:
| Technique | Spatial Resolution Range | Notes |
|---|---|---|
| SIMS (Secondary Ion MS) | 100 nm to 1 μm | Offers the highest lateral resolution; suitable for organelle-level imaging. |
| MALDI (Matrix-Assisted Laser Desorption) | 1.4 μm to 150 μm | Routine resolution is approximately 20 μm. Advanced setups reach subcellular levels. |
| LAESI / DESI | 40 μm to 200 μm | Generally lower resolution; DESI is often preferred for rhizosphere analysis because it works at atmospheric pressure. |
| LDPI (Laser Desorption Postionization) | 2 μm to 100 μm | Utilizes secondary lasers to enhance ionization. |
| Liquid Microjunction Probes | 70 μm to 260 μm | Limited resolution but useful for specific surface sampling. |
High-Resolution Advancements
While SIMS has traditionally dominated high-resolution imaging, recent developments have allowed MALDI systems to approach or enter the sub-micrometer range:
- t-MALDI-2: Utilizing transmission-mode geometry and post-ionization, researchers have achieved a pixel size of 600 nm in brain tissue.
- AP-MALDI: Atmospheric pressure MALDI setups have demonstrated lateral resolutions as fine as 1.4 μm.
- Nano Laser Probes: Recent probe-based systems using micro-lensed fibers can push MALDI resolution down to the nanometer level.
- NanoSIMS: This specialized form of SIMS remains the gold standard for high-resolution elemental and small molecule imaging at the nm scale.
Determinants of Spatial Resolution
Several technical factors limit or enable the resolution of an MSI experiment:
- Probe Diameter: The minimum resolution is fundamentally limited by the diameter of the laser beam (in MALDI) or the primary ion beam (in SIMS).
- Matrix Application: For MALDI, the matrix crystal size is a critical bottleneck. Sublimation is considered the best method for high-resolution analysis because it produces a uniform layer of very small crystals. Conversely, robotic spotting results in large droplets and lower resolution (approx. 200 μm).
- Raster Width: This refers to the distance the laser or ion beam moves between shots. A smaller “raster width” or “scan pitch” increases resolution but drastically increases data file size and acquisition time.
- Sample Integrity: Any movement or delocalization of analytes during preparation (such as “overspraying” a liquid matrix) can blur spatial distributions, effectively lowering the practical resolution.
3. How do MALDI and SIMS differ in spatial resolution?
MALDI and SIMS represent two primary mass spectrometry imaging (MSI) techniques with significantly different spatial resolutions, ranging from the micrometer level for routine MALDI to the nanometer level for specialized SIMS.
Fundamental Resolution Comparison
- SIMS (Secondary Ion Mass Spectrometry): Offers the highest lateral resolution among MSI techniques. It routinely achieves resolutions between 100 nm and 1 µm. Specialized versions like NanoSIMS can achieve resolutions at the nanometer level, allowing for the imaging of elements and small molecules at the organelle level.
- MALDI (Matrix-Assisted Laser Desorption/Ionization): Traditionally considered a lower-resolution technique compared to SIMS. Routine commercial MALDI instruments in microprobe mode typically achieve spatial resolutions of 10–100 µm or just below 20 µm.
Advances in MALDI Resolution
Recent technological developments have allowed MALDI to approach and even enter the sub-micrometer range previously dominated by SIMS:
- t-MALDI-2 (Transmission Mode): By utilizing back-side illumination geometry, this technique has achieved a high pixel size of 600 nm in brain tissue.
- AP-MALDI (Atmospheric Pressure): This setup has demonstrated a lateral resolution of 1.4 µm.
- Nano Laser Probes: Recent systems using micro-lensed fibers can push MALDI resolution down to the nanometer level.
- Gel-assisted Lipidomics: New workflows in 2024 have pushed spatial resolution to the submicrometer scale for interrogating subcellular structures.
Determinants of Resolution
The spatial resolution of each technique is governed by different physical constraints:
- Beam Diameter: In SIMS, resolution is limited by the diameter of the primary ion beam. In MALDI, it is fundamentally limited by the diameter of the laser beam.
- Matrix Properties (MALDI only): The size of the matrix crystals is a critical bottleneck for MALDI resolution. Sublimation is preferred for high-resolution experiments because it produces a uniform layer of very small crystals, whereas robotic spotting results in larger droplets and lower resolution (~200 µm).
- Sampling Mode: Techniques like oversampling allow MALDI to image features smaller than the actual laser beam size by ablating overlapping areas.
Resolution vs. Mass Range Trade-off
While SIMS provides superior spatial resolution, it is often limited in the size of molecules it can detect. The energetic particles used in SIMS cause fragmentation of most molecular species larger than ~1,000 Da, though cluster ion sources can extend this to approximately 2 kDa. In contrast, MALDI is a “soft” ionization technique that can measure a much broader mass range, extending to large proteins exceeding 100 kDa. Thus, researchers must often choose between the nm-level resolution of SIMS for small molecules and the µm-level resolution of MALDI for larger biomolecules like intact proteins.
4. Which MSI techniques are best for imaging living biofilms?
For imaging living biofilms in their native state, atmospheric pressure MSI techniques are generally considered the best options because they bypass the need for sample drying or freezing, which can distort biofilm structures.
The most suitable techniques for this purpose include:
1. DESI and LAESI (Atmospheric Pressure)
- DESI (Desorption Electrospray Ionization): This technique operates at atmospheric pressure, making it ideal for analyzing living samples in their native liquid or hydrated state. However, DESI has a relatively poor lateral resolution (typically 40–200 μm) compared to vacuum-based methods.
- LAESI (Laser Ablation Electrospray Ionization): This is conceptually similar to MALDI but uses the water inherent in the sample as the matrix. This makes it highly effective for plant and biofilm analysis where maintaining hydration is critical. While its resolution is higher than DESI, it is generally lower than MALDI.
2. ToF-SIMS with Microfluidic Integration
While ToF-SIMS usually requires high-vacuum conditions (which typically necessitate dried samples), it can be used to image living biofilms if coupled with specialized microfluidic devices like SALVI (System for Analysis at the Liquid-Vacuum Interface).
- SALVI allows living biological specimens to be maintained in a liquid state within high-vacuum instruments.
- This setup enables researchers to obtain subcellular spatial resolution images of interactions within a living biofilm, though there is a trade-off in mass accuracy and resolution compared to analyzing dried samples.
3. Liquid Microjunction Surface-Sampling Probe
This technique is noted for its ability to perform in situ detection of biomolecules, such as amino acids, directly from bacterial biofilms and plant root exudates. It typically offers a lateral resolution between 70 μm and 260 μm.
Why these are preferred over MALDI for “Living” Samples
Traditional MALDI-MSI is less suited for imaging living biofilms because it generally requires the sample to be completely dry before entering the vacuum source. The drying process can lead to “flaking” of the sample or significant distortion of the biofilm’s native structure. While some MALDI protocols use wet-sieving for matrix application, the ultimate requirement for a vacuum-compatible dry sample remains a barrier for true living analysis.
How is machine learning used to analyze MSI data?
Machine learning (ML) and artificial intelligence are increasingly essential for analyzing the massive, high-dimensional datasets generated by Mass Spectrometry Imaging (MSI). Because MSI data files can reach gigabyte sizes and contain thousands of pixels—each associated with a complete mass spectrum—advanced computational solutions are required to handle processing, integration, and storage.
Core Applications of Machine Learning in MSI
Machine learning is primarily used for classification, biomarker discovery, and the automation of data interpretation:
- Pathological and Cancer Classification: ML algorithms combined with MALDI-MSI have been used to classify various cancers, such as renal oncocytoma and clear cell renal cell carcinoma, achieving an accuracy of 87%. It has also been applied to delineate and delineate pituitary tumors for intraoperative surgical decision-making.
- Microbial Identification and Drug Resistance: In microbiology, ML-driven analysis of MALDI-derived data enables subspecies-level discrimination and provides indications of antimicrobial resistance risk for pathogens like Staphylococcus and the Mycobacterium abscessus complex.
- Product Characterization: Researchers have used ML statistical algorithms to differentiate biological materials, such as bovine milk, through their intact peptidomes to identify changes caused by thermal degradation.
- 3D Metabolomic Atlasing: AI-driven frameworks have been developed to perform systematic three-dimensional mapping of the metabolome in large specimens, such as the brain.
Methodologies and Algorithms
While traditional multivariate statistical analysis methods like Principal Component Analysis (PCA) and Non-negative Matrix Factorization (NMF) are standard for dimension reduction and feature extraction, more sophisticated ML techniques are becoming popular for handling non-linear patterns:
- Non-linear Visualization: Techniques such as t-distributed stochastic neighbor embedding (t-SNE) and uniform manifold approximation and projection (UMAP) are used when MSI datasets exhibit non-linear patterns.
- Self-Organizing Maps (SOMs): SOMs are increasingly used to interpret complex ToF-SIMS data, offering an intuitive approach for visualizing relationships between individual pixels and spectra, particularly for discriminating between similar high-weight polymers.
- Deep Learning: Advanced deep-learning methods are used for feature extraction and image segmentation, which helps separate biologically meaningful spatial patterns from background noise and matrix-driven artifacts.
Future Directions in AI-Assisted Analysis
The field is shifting from manual, feature-centric workflows toward automated, hypothesis-generating frameworks. Future analytical pipelines are expected to utilize unsupervised and representation-learning approaches to uncover previously unrecognized metabolite–phenotype associations. These advancements will be pivotal for transitioning microbial and clinical MSI from predominantly qualitative mapping toward robust, reproducible, and quantitatively defensible spatial molecular analysis.
5. Teach me how sample preparation affects the quality of imaging.
Sample preparation is the most critical stage of Mass Spectrometry Imaging (MSI), often described as being responsible for 99% of the integrity of the results. Because MSI maps molecules in their native environments, any error during preparation can cause molecules to move (delocalization), degrade, or be masked by chemical noise.
The quality of imaging is affected by several key preparation phases:
1. Preservation and Embedding
- Fixation: Fresh-frozen tissue is the gold standard because it preserves the proteome in its native state. While Formalin-Fixed Paraffin-Embedded (FFPE) tissues are common in clinics, the formalin induces protein cross-linking that blocks MS signals unless intensive “antigen retrieval” and tryptic digestion are performed.
- Embedding Media: Conventional media like OCT (Optimal Cutting Temperature) must be avoided because they cause significant ion suppression and create “noise” in the mass spectrometer. Instead, researchers use carboxymethylcellulose (CMC) or gelatin, which do not interfere with analyte detection.
2. Sectioning and Mounting
- Thickness: Section thickness directly influences ionization efficiency. Generally, 5–20 μm sections are used for small molecules, while thinner sections (2–5 μm) are preferred for high-molecular-weight proteins.
- Surface Flatness: The sample must be as flat as possible. Height variations cause decreased mass accuracy and can create “dead spots” where no data is acquired.
- Conductivity: Samples are mounted on ITO (Indium Tin Oxide)-coated glass slides. These conductive slides prevent the buildup of electrical charge, which would otherwise result in poor ionization and image distortion.
3. Tissue Washing (Pretreatment)
Washing is a “make or break” step depending on the target molecule:
- Salt Removal: Physiological salts interfere with matrix crystallization and suppress signals. Aqueous washes (e.g., cold water) are used to remove these salts, particularly for lipid analysis.
- Lipid Removal: For protein imaging, organic washes (ethanol or isopropanol) are essential to remove lipids that would otherwise mask the protein signals.
4. Matrix Application
The method of applying the matrix determines the balance between sensitivity and spatial resolution:
- Robotic Spotting: Offers excellent analyte extraction and high sensitivity but results in low spatial resolution (typically 150–250 μm).
- Spraying (Aerosol): Provides better resolution (10–20 μm). However, “overspraying” makes the tissue too wet, causing analyte delocalization (blurring the image), while “underspraying” results in poor extraction.
- Sublimation: Produces the smallest matrix crystals and highest spatial resolution (~1.4 μm to 10 μm). Because it is solvent-free, it prevents delocalization but often requires a subsequent “rehydration” step to improve extraction efficiency.
5. Integrity and Artifacts
- Analyte Delocalization: If the sample becomes too wet during matrix application or washing, molecules can migrate from their original positions, resulting in a false representation of their distribution.
- Vacuum Stability: If air bubbles are trapped under the tissue during mounting, the section may flake or break off once placed under vacuum, potentially damaging the instrument and ruining the imaging run.
- Standardization: Because even minor deviations in handling can change the results, standard operating protocols (SOPs) are required to ensure that differences seen in images are biological rather than preparation-induced artifacts.
6. How does SALVI maintain living biofilms in a vacuum?
The SALVI (System for Analysis at the Liquid–Vacuum Interface) device maintains living biofilms in a vacuum by functioning as a specialized microfluidic device designed to handle high vapor pressure.
The key features of how it maintains these living systems include:
- Vapor Pressure Management: SALVI is engineered to maintain liquids and viable biological specimens with high vapor pressure within the high-vacuum environments of instruments such as time-of-flight mass analyzers and scanning electron microscopes.
- Preservation of Liquid State: Unlike traditional MSI sample preparation—which requires samples to be completely dried or cryogenically frozen—SALVI allows the biofilm to remain in its native liquid state during analysis.
- In Situ Imaging: By keeping the sample hydrated and viable, the device enables researchers to obtain in situ molecular images of the biofilm and its matrix without the “flaking,” chipping, or structural distortions caused by dehydration.
- Technical Trade-offs: While it preserves the living state, using SALVI in liquid SIMS (Secondary Ion Mass Spectrometry) often requires an imaging mode that results in a reduction in mass accuracy and resolution compared to the spectral mode used for dried organics.
7. How does deep learning help with image segmentation in MSI?
Deep learning (DL) is becoming an indispensable tool for managing the massive, high-dimensional datasets generated by Mass Spectrometry Imaging (MSI), specifically aiding in image segmentation to separate biologically meaningful patterns from complex backgrounds.
The role of deep learning in MSI segmentation includes the following key functions:
1. Separating Biology from Noise and Artifacts
MSI data often contains significant chemical background noise and artifacts driven by the organic matrix used in techniques like MALDI. Deep-learning–based segmentation helps researchers more reliably distinguish true biological spatial patterns from these non-biological signals. This is critical for ensuring that the resulting molecular maps accurately represent the sample’s native biochemistry rather than preparation-induced interference.
2. Automated Feature Extraction and Pattern Discovery
Because MSI files can reach gigabyte sizes and contain thousands of pixels—each associated with a full mass spectrum—manual interpretation is impractical. Deep learning matures the workflow by providing automated feature extraction and pattern discovery. These algorithms can group similar spectra together based on intensity and spatial distribution to identify “molecularly distinct regions” or phenotypic subpopulations within a sample.
3. Multimodal Integration and Guidance
Deep learning is often used in multimodal workflows that combine MSI with optical microscopy. For example, in the “SpaceM” method, deep learning facilitates the segmentation of light microscopy images first to provide phenotypic information, such as cell morphology and fluorescence intensity. This information is then registered with the MALDI pixel data to integrate metabolic profiles with specific cellular phenotypes.
4. Hypothesis Generation and Subpopulation Discovery
Advanced DL frameworks allow for the de novo identification of subpopulations within heterogeneous tissues, such as tumors, without requiring prior knowledge of the sample’s molecular makeup. By moving from manual, feature-centric analysis toward automated, unsupervised representation-learning approaches, deep learning helps uncover previously unrecognized metabolite–phenotype associations.
5. Enhanced Quantitative Reliability
In microbial systems and complex ecosystems, strong and spatially variable ion suppression makes quantification difficult. Deep learning facilitates more sophisticated data-processing frameworks that combine adaptive peak detection and robust cross-sample normalization to provide a more quantitatively defensible spatial analysis.
8. Can ML detect antimicrobial resistance in plant-growth-promoting bacteria?
The provided sources indicate that machine learning (ML) can indeed detect antimicrobial resistance (AMR) in various bacterial strains, including those that fall under the category of plant-growth-promoting bacteria (PGPB).
Methodology for Detection
The detection of AMR using ML is typically achieved by integrating mass spectrometry data (such as protein fingerprints or lipidomic signatures) with advanced algorithms:
- Protein Fingerprinting: MALDI-TOF MS identifies spectral signatures of highly conserved ribosomal proteins. Machine learning algorithms can then leverage these signatures to predict antimicrobial resistance phenotypes with high accuracy and precision.
- Lipidomic Signatures: In certain complexes, such as the Mycobacterium abscessus complex, characteristic lipidomic signatures derived from MALDI-MSI are used by ML algorithms to provide indications of antimicrobial resistance risk.
- High Performance: Experiments combining MALDI-TOF and ML for antimicrobial resistance screening have yielded results with high accuracy and precision, demonstrating the potential for rapid diagnostic applications.
Application to Plant-Growth-Promoting Bacteria
While much of the research on AMR and ML focuses on clinical pathogens, there is a direct intersection with PGPB:
- Shared Strains: The sources identify Acinetobacter as a common plant-growth-promoting rhizobacterium. At the same time, Acinetobacter is part of the ESKAPE pathogens, for which the sources explicitly state that characteristic protein spectral signatures can be used to predict antimicrobial resistance phenotypes.
- Subspecies Discrimination: ML-driven analysis of MALDI data allows for subspecies-level discrimination and identifies resistance risks in complex microbial environments.
- In Situ Imaging: MSI techniques like ToF-SIMS have been used to study the interactions of PGPB (such as Pseudomonas fluorescens and Arthrobacter chlorophenolicus) on plant surfaces (the spermosphere). By combining this spatial molecular information with ML, researchers can identify chemical communication patterns and resistance behaviors directly in their native ecological context.
Future Outlook
The field is moving toward automated, hypothesis-generating frameworks where deep-learning methods are used for feature extraction and image segmentation. These advancements are expected to enable more robust diagnostic stratification and treatment optimization for microbial infections across clinical and agricultural settings.
9. What are the benefits of using Self-Organizing Maps (SOMs)?
Self-Organizing Maps (SOMs) are an artificial neural network-based machine learning technique used to interpret and visualize the massive, high-dimensional datasets produced by Mass Spectrometry Imaging (MSI).
The primary benefits of using SOMs in MSI analysis include:
- Handling Non-linear Patterns: SOMs are particularly effective when MSI datasets exhibit non-linear patterns, which can be difficult for traditional multivariate statistical methods like Principal Component Analysis (PCA) to resolve.
- Intuitive Visualization: They offer an intuitive approach for visualizing the complex relationships between individual pixels and their corresponding mass spectra, making it easier to interpret the spatial-chemical data.
- Superior Discrimination: SOMs have demonstrated a high level of success in discriminating between high-weight polymers that possess very similar chemical structures and compositions.
- Accuracy in Surface Chemistry: They can reveal accurate information regarding surface chemistries (specifically in polymer research), providing a clearer picture of the sample’s molecular makeup.
- Potential in Ecological Research: In the study of plant–microbe interactions, SOMs are viewed as a beneficial tool for determining metabolite secretions, such as those composed of heavy amino acids, lipids, and fatty acid chains.
While PCA remains more widely used, SOMs are becoming increasingly popular for biological and polymeric sample research because they offer these unique analytical advantages over standard factorization methods.
10. Can ML automate the identification of metabolic pathways?
Machine learning (ML) and artificial intelligence are increasingly being integrated into Mass Spectrometry Imaging (MSI) workflows to shift analysis from manual, feature-centric methods toward automated, hypothesis-generating frameworks. While the sources suggest the field is still maturing toward full automation, AI-assisted interpretation is already being used to identify and map complex metabolic activities.
Role of ML in Pathway Identification
Machine learning helps automate the interpretation of high-dimensional MSI data in several ways:
- 3D Metabolomic Atlasing: AI-driven frameworks have been developed to perform systematic three-dimensional mapping of the metabolome in large specimens, such as the brain.
- Pattern Discovery and Segmentation: Deep-learning methods are used for feature extraction and image segmentation, which help separate biologically meaningful spatial patterns from background noise. This allows for the identification of “molecularly distinct regions” that correspond to specific metabolic states.
- Uncovering Hidden Associations: Unsupervised and representation-learning approaches are expected to help uncover previously unrecognized metabolite–phenotype associations, generating testable hypotheses about metabolic pathways.
- Database Integration: Information from high-resolution mass spectrometry can be aligned with molecular databases (such as MetLin or KEGG), which is then integrated into pathway analysis to identify active pathways directly from individual cell types within a tissue.
Quantitative Pathway Mapping
Beyond mere identification, advanced MSI techniques provide insights into pathway dynamics:
- Flux-like Information: In vivo stable-isotope tracing coupled with MALDI-MSI can map isotope incorporation into downstream metabolites. This allows researchers to quantify pathway activity and substrate contribution spatially, providing “flux-like information” on metabolic routing even when absolute concentrations are unknown.
- Subcellular Insights: New developments in microfluidic devices used under vacuum have the potential to further elucidate metabolic pathways and cell-to-cell interactions at a subcellular spatial resolution.
Limitations to Full Automation
Despite these advancements, full automation faces technical hurdles:
Standardization: The lack of community-accepted, end-to-end pipelines for sample preparation and data reporting currently limits the stability of automated cross-sample comparisons.
Molecular Identification Bottlenecks: Confident molecular identification remains a challenge due to incomplete spectral libraries and limited MS/MS coverage in imaging mode, which can lead to ambiguous assignments.
Spectral Overlap: In complex samples, mass spectral signals from different molecules often overlap, making it difficult for algorithms to accurately discriminate structurally similar metabolites.
References
Aichler, M., & Walch, A. (2015). MALDI Imaging mass spectrometry: Current frontiers and perspectives in pathology research and practice. Laboratory Investigation, 95(4), 422–431. https://doi.org/10.1038/labinvest.2014.156
Cornett, D. S., Reyzer, M. L., Chaurand, P., & Caprioli, R. M. (2007). MALDI imaging mass spectrometry: Molecular snapshots of biochemical systems. Nature Methods, 4(10), 828–833. https://doi.org/10.1038/nmeth1094
Gessel, M. M., Norris, J. L., & Caprioli, R. M. (2014). MALDI imaging mass spectrometry: Spatial molecular analysis to enable a new age of discovery. In Journal of Proteomics (Vol. 107, pp. 71–82). Elsevier. https://doi.org/10.1016/j.jprot.2014.03.021
Gustafsson, J. O. R., Oehler, M. K., Ruszkiewicz, A., McColl, S. R., & Hoffmann, P. (2011). MALDI imaging mass spectrometry (MALDI-IMS)-application of spatial proteomics for ovarian cancer classification and diagnosis. In International Journal of Molecular Sciences (Vol. 12, Number 1, pp. 773–794). https://doi.org/10.3390/ijms12010773
McCaughey, C. S., Trebino, M. A., Yildiz, F. H., & Sanchez, L. M. (2022). Utilizing imaging mass spectrometry to analyze microbial biofilm chemical responses to exogenous compounds. In Methods in Enzymology (Vol. 665, pp. 281–304). Academic Press Inc. https://doi.org/10.1016/bs.mie.2021.11.014
Parker, G. D., Hanley, L., & Yu, X. Y. (2023). Mass Spectral Imaging to Map Plant–Microbe Interactions. In Microorganisms (Vol. 11, Number 8). Multidisciplinary Digital Publishing Institute (MDPI). https://doi.org/10.3390/microorganisms11082045
Wang, D., Feng, D., Yang, Y., Xie, H., & Liu, L. (2026). Applications and technical challenges of MALDI mass spectrometry imaging in microbial ecosystems and metabolic network research. In Archives of microbiology (Vol. 208, Number 6). https://doi.org/10.1007/s00203-026-04838-1
Zaima, N., Hayasaka, T., Goto-Inoue, N., & Setou, M. (2010). Matrix-assisted laser desorption/ionization imaging mass spectrometry. In International Journal of Molecular Sciences (Vol. 11, Number 12, pp. 5040–5055). https://doi.org/10.3390/ijms11125040
Zhu, X., Xu, T., Peng, C., & Wu, S. (2022). Advances in MALDI Mass Spectrometry Imaging Single Cell and Tissues. In Frontiers in Chemistry (Vol. 9). Frontiers Media S.A. https://doi.org/10.3389/fchem.2021.782432
Related posts:
 Integrated Pest Management (IPM): Fundamentals, Practice, and Professional Communication
 Sustainable Growing Media Boosts Glasshouse Strawberry Production and Soil Health
 Boosting Sunflower Growth in Saline Soils: The Role of Phosphate-Solubilizing Bacteria and Phosphorus-Enriched Biochar
 Boosting Crop Protection: How VOC-Mediated Plant Defense Priming is Revolutionizing Integrated Pest Management
 Hot Springs Yield New Weapons Against Superbugs: Antimicrobial Peptides from Thermophilic Bacteria