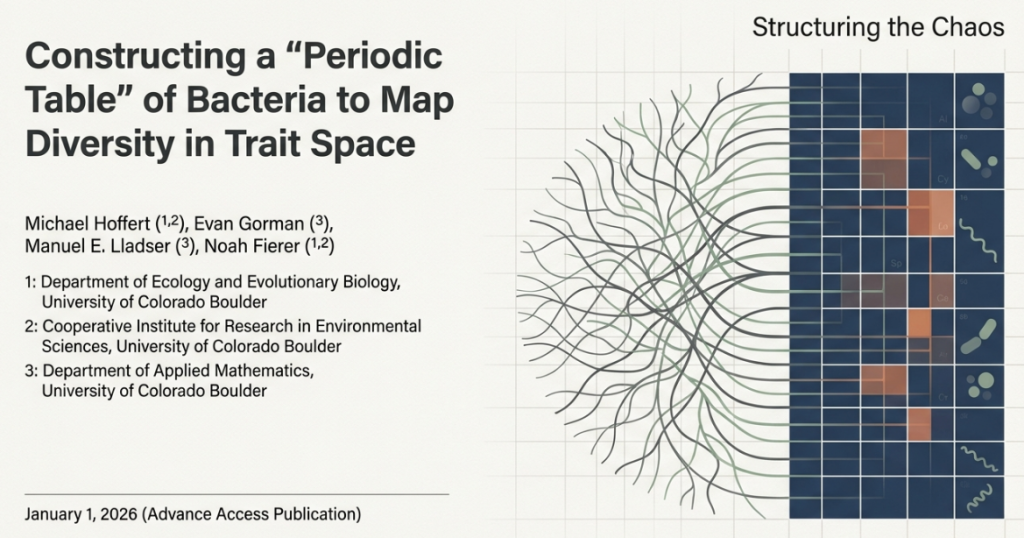
1. The Cartography of the Invisible
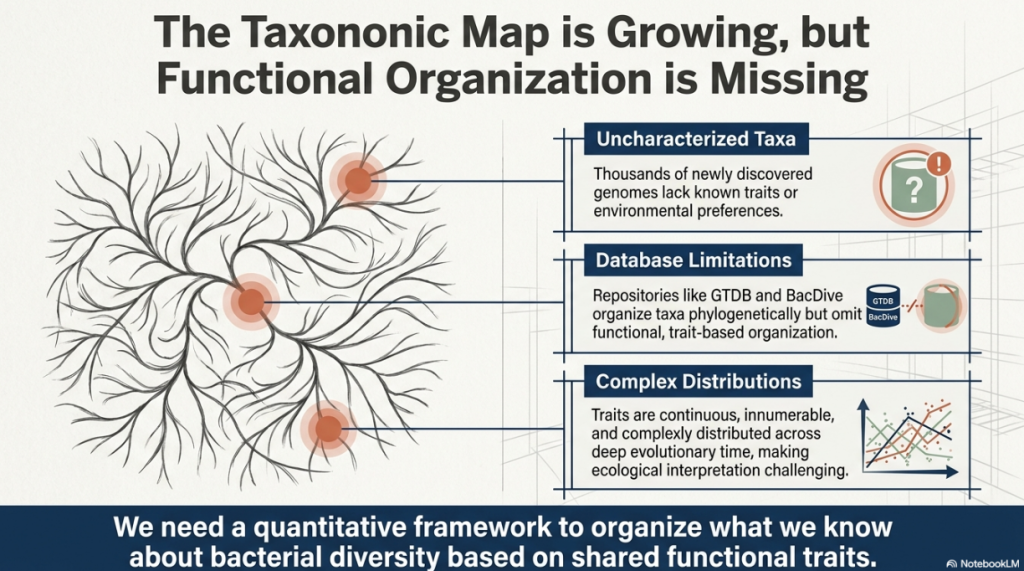
To understand the scale of the microbial world is to confront a staggering sense of chaos. There are more bacteria on Earth than stars in the observable universe, yet our map of this microscopic frontier remains largely blank. The genomic revolution has flooded our servers with blueprints—tens of thousands of genetic sequences—but we are still missing the architectural legends required to read them. While we have discovered a vast array of bacterial taxa (distinct groups of organisms), most remain “uncharacterized” mysteries. We possess their DNA, but we do not know their stories: how fast they grow, what they “eat,” or how they breathe.
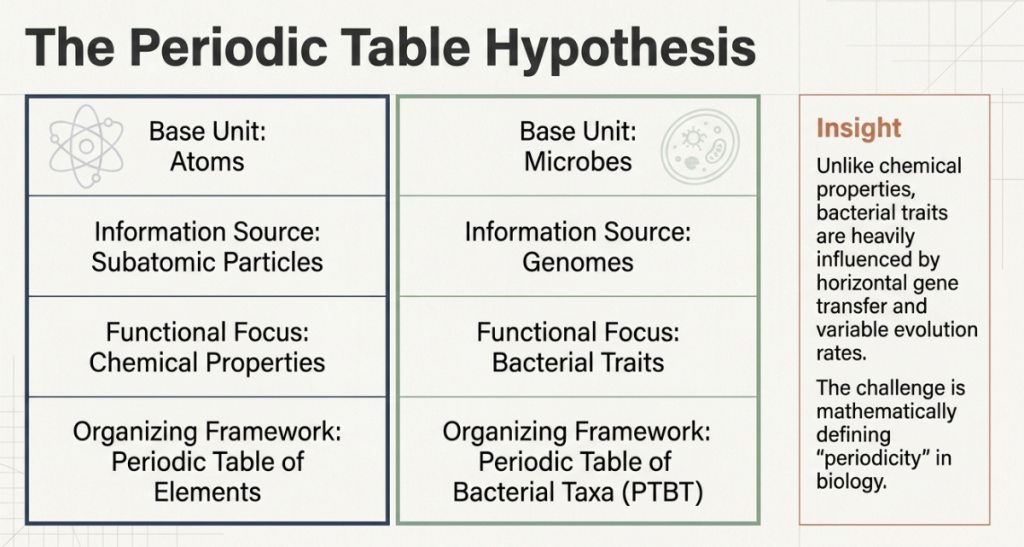
In the current landscape of microbiology, our primary tools for organization are databases like the Genome Taxonomy Database (GTDB) or BacDive. These serve as invaluable “phone books,” listing names and evolutionary relationships (phylogeny), but they lack a functional organization system. Knowing where a bacterium sits on the tree of life doesn’t always tell you how it behaves in an ecosystem. This “information gap” hinders our ability to interpret ecological patterns—to explain why certain bacteria thrive in a human gut while others dominate deep-sea vents. To move from discovery to strategic understanding, we need a map that captures periodicity: the phenomenon where biological traits repeat in predictable patterns across the tree of life. Inspired by the chemical order that transformed the 19th century, researchers have developed a solution: the Periodic Table of Bacterial Taxa (PTBT).
2. The Vision: A Periodic Table for Life
The original Periodic Table of Elements succeeded because it organized atoms by their properties, revealing that nature is “periodic.” The researchers in this study propose that bacteria follow a similar logic. By treating bacterial “traits”—such as oxygen preference or genome size—as biological equivalents to chemical properties, we can predict a microbe’s “ecological strategy” based on its position in a structured map.
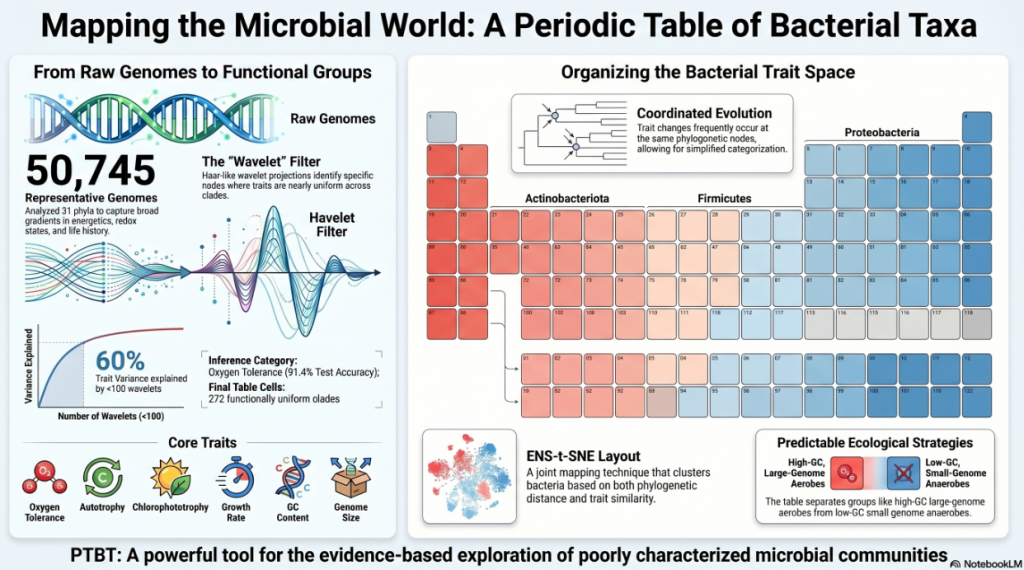
The scope of this endeavor is massive. The team analyzed 50,745 genomes across 31 bacterial phyla (the broad “branches” of the tree of life). The goal was not merely to list these microbes but to identify the predictable repetitions of their lifestyles. Just as the configuration of electrons determines how an atom reacts, a specific set of traits determines a bacterium’s behavior. By mapping these traits onto a common framework, the PTBT collapses the overwhelming complexity of 50,000 individual species into a manageable set of “cells” that share a common functional identity.
3. Methodology: The Mathematical Balance Scale
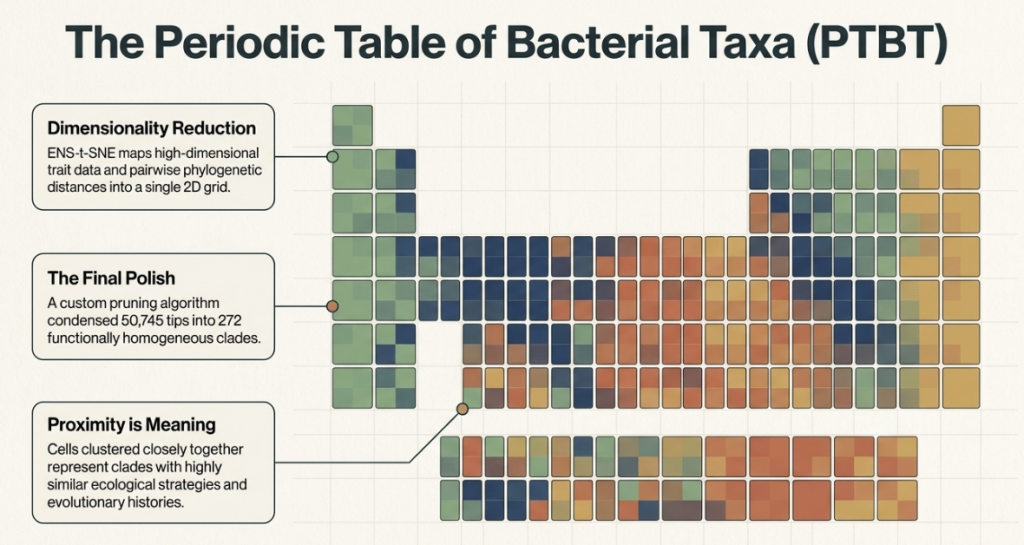
A tree with 50,000 leaves is impossible for the human eye to navigate. To create a functional table, the researchers had to “prune” this tree, collapsing monophyletic groups (descendants of a single common ancestor) that behave similarly into single “cells.” This required a sophisticated mathematical tool known as the Haar-like wavelet projection (HWP).
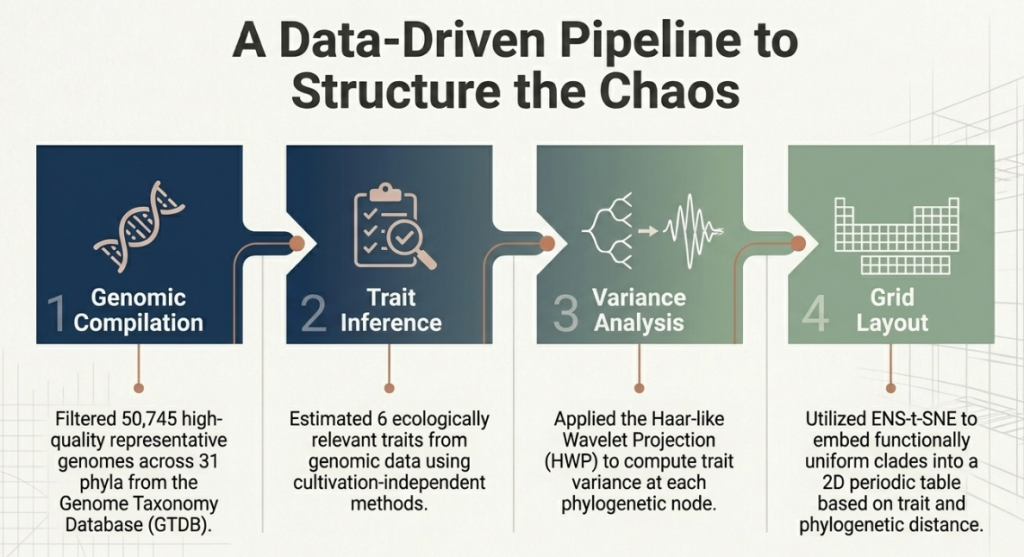
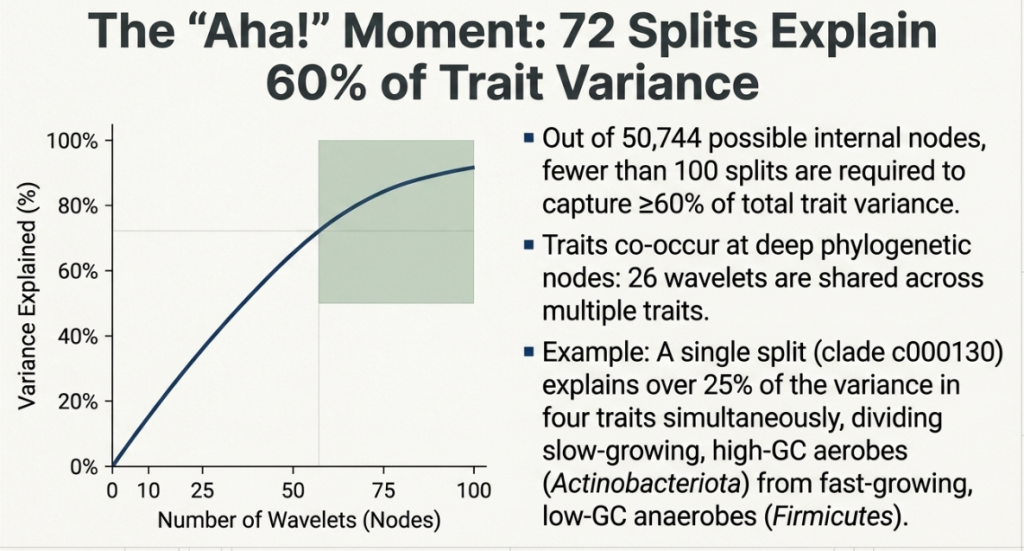
Think of HWP not just as a lens, but as a mathematical balance scale. As it moves through the tree, it measures the “trait variance” (the difference in behavior) between the left and right subtrees of every node. If the variance is low, it means the bacteria on both sides are functionally identical. If the variance is high, it marks a significant “lifestyle shift” in evolution. By identifying these shifts, the HWP allowed the researchers to prune the 50,745 individual tips down to just 272 “cells.”
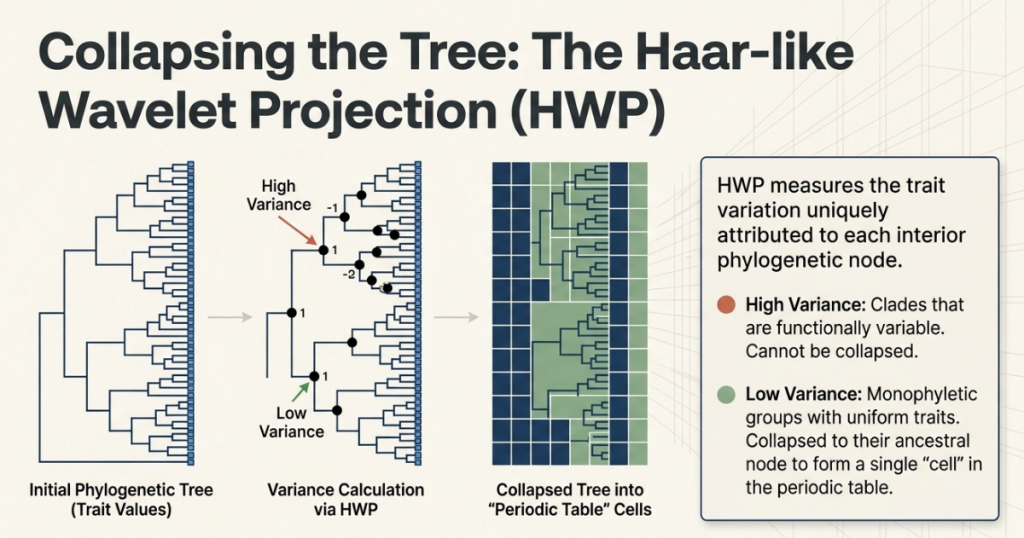
This simplification is a strategic masterpiece: by using only these 272 units, the table still manages to capture 60% of the total functional diversity of the entire bacterial kingdom. This justifies the “strategic necessity” of the table; it provides a high-fidelity summary that remains visually interpretable for human scientists.
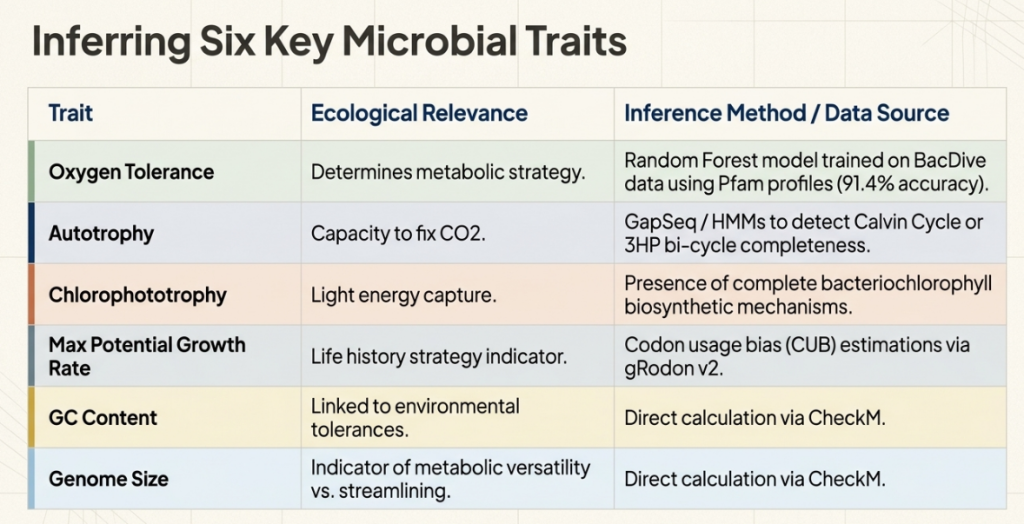
4. The Six Pillars of Bacterial Identity
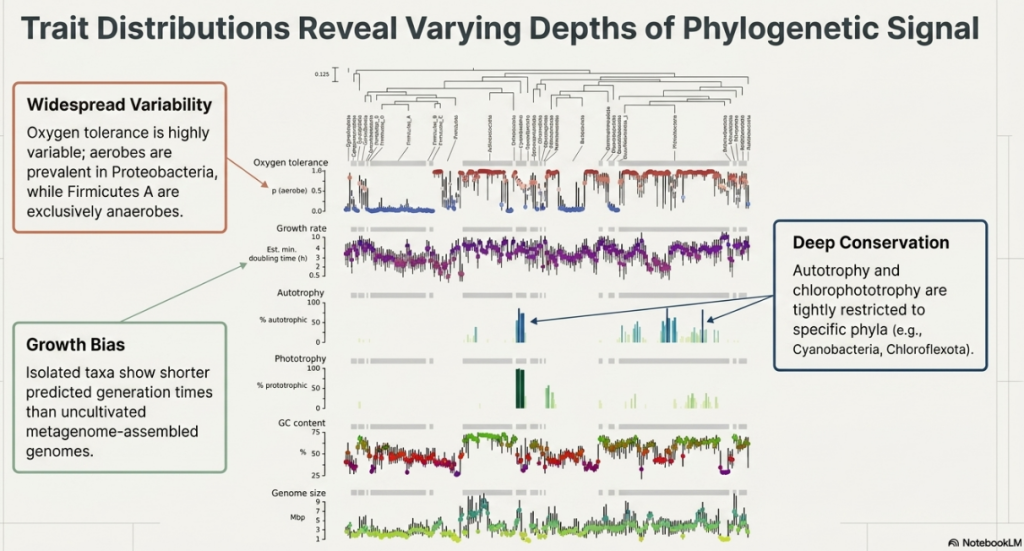
Not all traits define a lifestyle. The researchers selected six key traits—the “pillars” of identity—that capture the essential trade-offs of microbial life. Crucially, these include both continuous traits (sliding scales) and binary traits (simple yes/no capacities).
- Oxygen Tolerance (Continuous):
- Layman’s Definition: The probability of being an “aerobe” (oxygen-user) versus an “anaerobe” (living without it).
- Strategic Impact: This dictates which environments a microbe can colonize, from the soil surface to the oxygen-free gut.
- Maximum Potential Growth Rate (Continuous):
- Layman’s Definition: The “speed limit” of the species—how fast it can reproduce under ideal conditions.
- Strategic Impact: This is a fixed genetic trait that separates “sprinters” that bloom in nutrient-rich environments from “marathoners” that grow slowly and steadily.
- Autotrophy (Binary):
- Layman’s Definition: A “yes/no” ability to “fix” CO2, making food from the air.
- Strategic Impact: Identifies the primary producers that form the base of the food chain.
- Chlorophototrophy (Binary):
- Layman’s Definition: A “yes/no” ability to capture energy from light.
- Strategic Impact: Like plants, these bacteria use the sun as an infinite energy source.
- GC Content (Continuous):
- Layman’s Definition: The percentage of DNA made of Guanine and Cytosine.
- Strategic Impact: Often a marker for environmental resilience and complex metabolic regulation.
- Genome Size (Continuous):
- Layman’s Definition: The total length of the genetic blueprint.
- Strategic Impact: Large genomes are “Swiss Army knives” for generalists; small genomes are “specialized scalpels.”
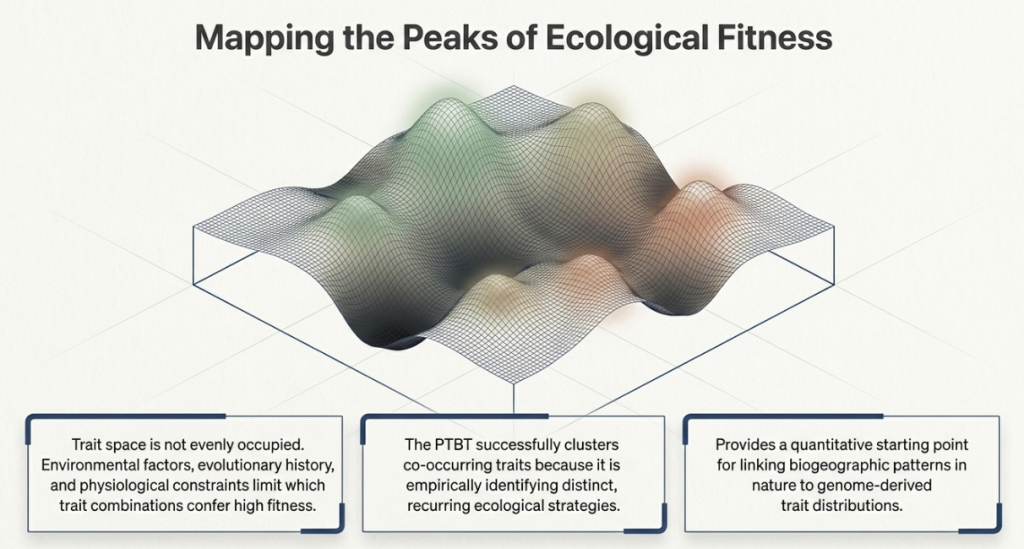
The “So What?” Layer: These traits don’t evolve in a vacuum. The study revealed a profound “periodic” fact: 25% of the variation in oxygen tolerance, growth rate, GC content, and genome size is attributed to a single phylogenetic split (clade c000130). This split marks the ancient divergence between high-GC, large-genome aerobic Actinobacteriota and low-GC, fast-growing anaerobic Firmicutes A. This single data point proves that microbial life is organized around predictable, repeating strategies.
5. Mapping the Results: Clusters and Ecological Strategies
When these 272 cells are arranged using a layout called ENS-t-SNE—which maps both evolutionary distance and trait similarity—functional “neighborhoods” emerge. These are the “Ecological Strategies” of the microbial world.
- Clusters 1 & 2 (The Firmicutes A Neighborhood): These are the anaerobes. Typically possessing small genomes and low GC content, they are specialized for environments like deep soil or the gut.
- Clusters 4, 5, 7, 8, & 9 (The Actinobacteriota & Proteobacteria Neighborhoods): This is the “metropolitan” area of the table. These bacteria are versatile aerobes with large genomes and high GC content. They are the generalists, capable of handling complex environments and diverse food sources.
- Cluster 10 (The Solar-Powered Neighborhood): Here we find the Cyanobacteriota. While they are aerobes, their unique ability to perform photoautotrophy places them in a distinct functional zip code. Interestingly, the PTBT reveals they are functionally far removed from their evolutionary sister clades, like the chemoheterotrophic Vampirovibrionia (found in Cluster 1), proving that functional neighbors are often more important than family ones.
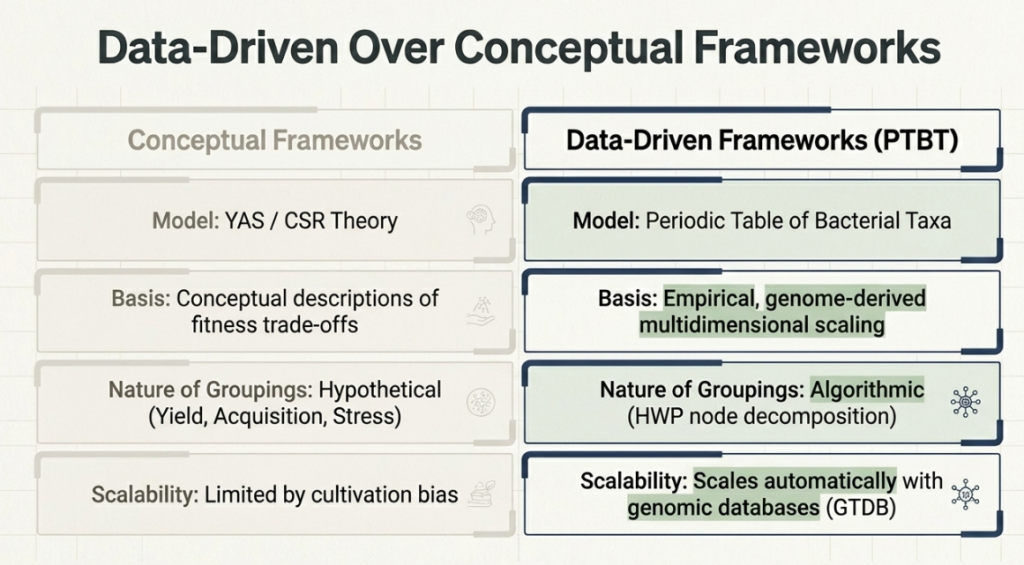
6. Future Horizons and Everyday Impact
The PTBT is the quantitative realization of conceptual models like CSR/YAS theory (which categorizes microbes as Competitors, Stress-tolerators, or Ruderals). It transforms these theories into an empirical map. For medicine and biotechnology, this is a game-changer. By seeing where a newly discovered, “uncultured” bacterium lands on the map, scientists can predict its traits with 60% accuracy without ever growing it in a lab.
Visualization Strategies for the PTBT
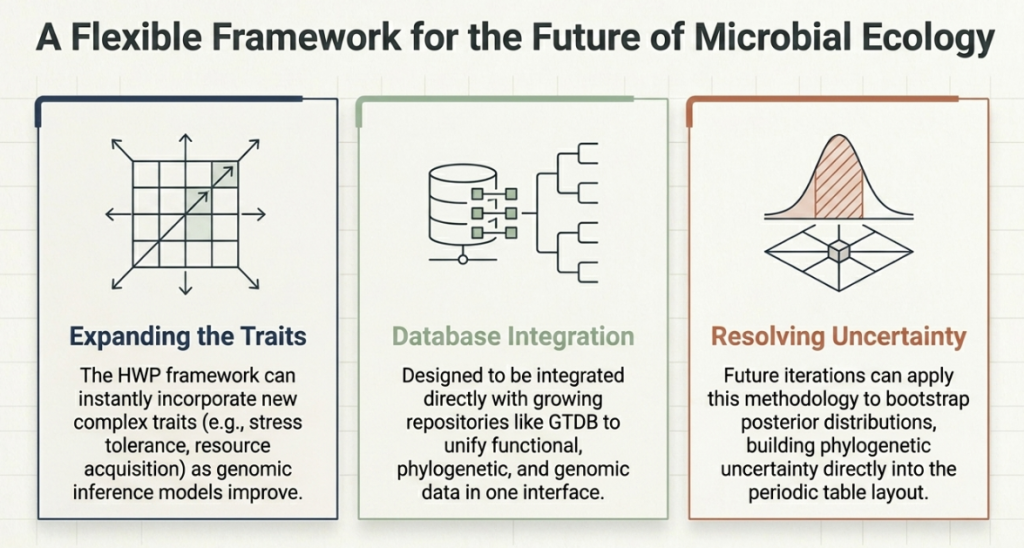
To help professionals navigate this new landscape, we suggest the following visual representations:
- A Tree-to-Table Flowchart: A visual narrative showing the HWP “balance scale” in action, illustrating how a 50,000-leaf tree is pruned into 272 functionally uniform cells.
- The Phylum Proximity Map: An ENS-t-SNE layout that uses spatial distance to show which groups (like certain Proteobacteria and Actinobacteriota) are functional neighbors despite being evolutionary strangers.
- Trait Probabilistic Heatmap: A grid where color intensity represents the probability of a trait (e.g., a “Red-to-Blue” scale for Oxygen Tolerance) across the 272 PTBT units.
7. Conclusion: A New Language for Biology
The Periodic Table of Bacterial Taxa is more than a chart; it is a new language for biology. It represents a shift from reductive science—where we focus on individual genes—to a visual summarization that captures the essence of life.
By transforming 50,000 genomes into a structured map of functional neighborhoods, this research has brought architectural logic to the microbial frontier. Much like Mendeleev’s table allowed chemists to predict elements before they were ever seen, the PTBT provides the framework to predict the roles of the “invisible majority.” It allows us, finally, to see the forest for the (microscopic) trees.
Reference
Hoffert, M., Gorman, E., Lladser, M. E., & Fierer, N. (2026). Constructing a “periodic table” of bacteria to map diversity in trait space. The ISME Journal, 20(1). https://doi.org/10.1093/ismejo/wraf289
Related posts:
 World Economic Forum: Top 10 Emerging Technologies of 2023
 Thiomargarita magnifica: The Bacteria Big Enough to be Visible by the Naked Eye
 Integrated Pest Management (IPM): Fundamentals, Practice, and Professional Communication
 Panama Wilt: Understanding and Managing the Banana Killer
 New Class of Antibiotics with a Novel Mode of Inhibition against World Health Organization’s Critical Listed Bacteria, Carbapenem-Resistant Acinetobacter baumannii